 RSMUS.com
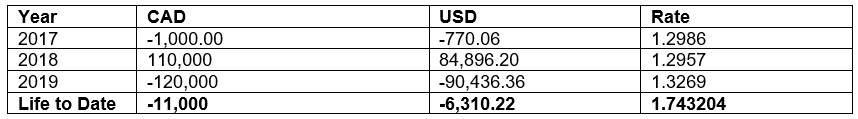
I get asked this question a lot from clients when they look at their retained earnings and their Cumulative Translation Adjustment numbers. In NetSuite, one can see that rate on the CTA Balance Audit report, which is generally when people become aware that they may have a company or two whose General Rate on the CTA Audit Report looks a bit “off” to their eye. Retained earnings are simply the sum total of each year’s P&L, both in the functional currency and the reporting currency. As a result, when there are large swings in P&L year to year, particularly going from a gain to a loss, the cumulative exchange rate can look very strange. If there is a question as to how the history, the easiest way to check is to simply put together a spreadsheet of the P&L in both the functional and the reporting currency, and it will be easy to see why the exchange looks strange. Here is an example of such a calculation. In this case, there is a big swing between 2018 and 2019, which is causing the odd exchange rate. So when in doubt, just put it on paper and you will be able to see why the exchange rate is looking odd.