Often, you’ll hear someone complain about the network being slow or a program being slow. To the ire of the system admins around the world we then set off on the wild goose chase known as troubleshooting, “It’s slow”. You check all the usual suspects: Network traffic, CPU and memory utilization, and finally you’ll get to disk utilization.
It’s always the last one checked, but is often the most troublesome and over looked. Why? Because troubleshooting disk utilization isn’t as black and white as network, CPU, or memory utilization. You have to get into more detail when looking at I/O (input/output) – it isn’t always as simple as watching a graph and looking at a few numbers to determine how utilized your disks are. Below are a couple tips you can do to determine if your disks are being stretched too far.
Microsoft Performance monitor
The gold standard of, “What am I looking at?”

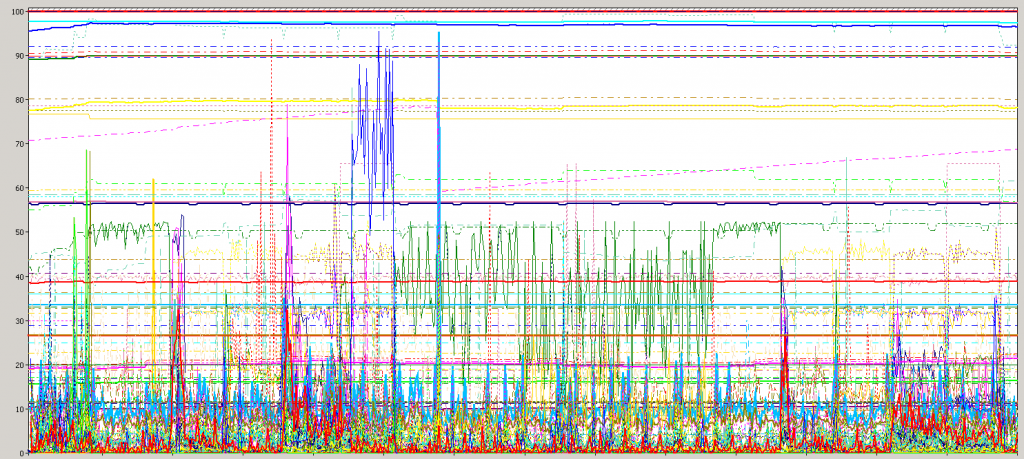
This is gibberish. However, if properly setup, performance monitor will be one of the most powerful tools you can use in your troubleshooting arsenal and it doesn’t cost you a dime!
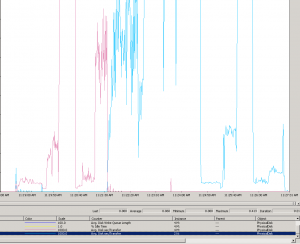
Average disk queue length
By looking at the average disk queue length of the drive you can get a better understanding of how long data has to wait before it is placed onto or read from the disks. This, however, is only useful if you know the number of disks your data is on. The general rule of thumb is that you’re queue length per disk should be under 2. So if you have 6 disks in your array and you have an average queue length of 15 you’re probably having some performance issues.
To put it another way, take 6 (the number of disks) times 2 (the number in which the disks become saturated) and you get 12 – which is the average queue length you can get to before you start running into performance issues. Anything above 12 is not optimal.
Average Disk/sec Transfer
If you don’t know the number of disks your data is running on, there is another simple to use method to determine if you are having disk related issues. Avg Disk/sec Transfer.
This monitor will allow you to gauge your systems performance without having to figure out exactly how many disks your system has access to. This is very useful if you have a SAN that has dozens of disks. Another rule of thumb is anything under 15ms is good, anything above 50ms is bad, anything in between is questionable. You’ll need to do some mental gymnastics by moving the decimal over a few places. So, when you see the average as .060 it means 60ms. This system should be looked at further.

SQLIO
This free Microsoft tool will enable you to see how much IO and throughput your server has available to use. You’ll often times hear about how many IOPS a SAN or server is capable of, but what does that mean in real world scenarios? The short answer, not much.
SQLIO will give you real world and easy to understand metrics to determine what you’re environment is capable of handling. For this example, we are only going to look at a small portion of the results. The latency your disks are experiencing. To start, you’ll need to download SQLIO from Microsoft’s site.
http://www.microsoft.com/en-us/download/details.aspx?id=20163
Once you download and install the utility, navigate to the directory you installed it to. Inside you will find a document with several sample commands, simply copy all the commands into a text file and save it in the same directory as sqlio.bat. Edit the batch file you just created and add one command at the end of each statement, so they look similar to this:
![]()
This will now create a file in the C:Temp directory that will have the test results. Save the batch file and close. In the directory that SQLIO is installed, locate and open the param.txt file. It will only have two lines in the document. We will only need to edit the first.
![]()
First, determine which drive you want to run the SQLIO test on. Secondly, edit the number after .dat to the number of cores on the system you are going to test. Finally, edit the last number to the size of the file you want SQLIO to create. You’ll want this to be the size of your production database or an estimation. Note, that this number is in megabytes so 10000 is equal to 10GB. Save that file. Now, you are ready to run.
To run SQLIO, simply double click the sqlio.bat file you created and wait. The test will take close to an hour to complete, but once it completes open the text file in C:Temp. Each test will create a block of text starting with SQLIO v1.5.5G and ending with a histrogram. For now, look at the latency metrics for each test.

Each test that runs will use different constraints to simulate different scenarios. We won’t get into the details of each right now, but you can use these to help determine the level of performance you can expect to see out of your environment.
Similar to the performance monitor tests above, the latency metrics will give you an idea of the time it takes for your disks to complete reads and writes. Lower is better in this case. You will want to see your minimum latency as low as possible and your average latency lower than 20ms. If you are having your max latency consistently spike over 200ms you’re disk sub system needs to be looked at.
The SQLIO tests will help determine much more then what we talked about above and I will go into more detail in a following blog post, but these few tips will help you better understand what is going on behind those blinking lights.
As always, if you want some more information, contact us! We will gladly look at your infrastructure and help determine if it needs a little TLC!

 RSMUS.com