
 RSMUS.com
One of the key areas of both current and legacy support is the connection to Microsoft Dynamics AX2012 Cubes. These cubes come with each version with the exception of Microsoft Dynamics 365 for Finance and Operations, Enterprise edition and are the most advanced in Release Three (R3). In this exercise we will review the process of refreshing the data in the cubes, linking PowerBI to the data set, and a sample set of visualizations.
This article is the continuation of a series on Power BI and the capabilities of the product. The purpose of this walk-through is to use data to quickly model a sample page that can be published to PowerBi.com. The assumption of this article is that you already have an Azure Active Directory account that is tied to your Power BI account. In addition, it assumes that you have already downloaded the local desktop version of Power BI.
Refresh AX2012 Cube Data
For this part of the process we will be using SQL Server Management Studio. The premise is that you have already deployed the cubes in AX2012 at least once. All of the basic demo images have had this loaded before you use them.
To refresh the data in AX2012 Demo image:
- Open SQL Server Management Studio.
- Select Analysis Services for Server Type.
- Click Connect.
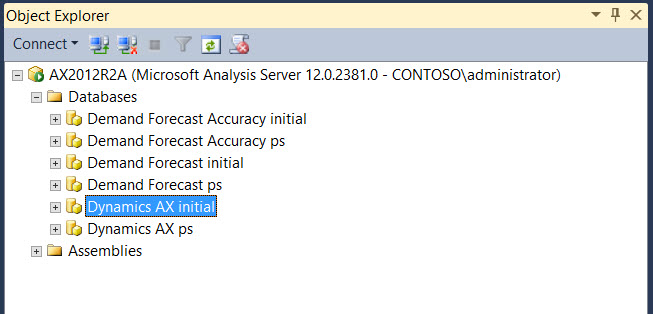
- Expand Databases, if not already.
- Select Dynamics AX initial.

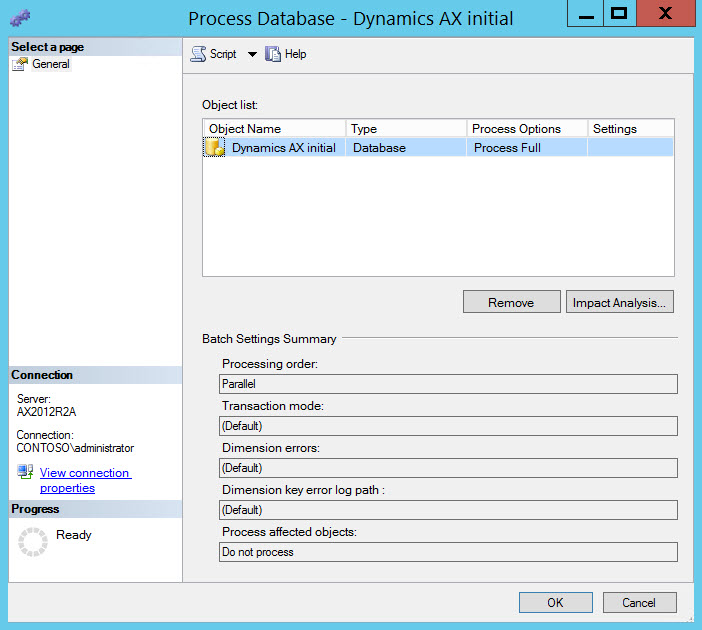
- Right click > Process
- Click OK.
- Once complete click Close.
- Close SQL Server Management Studio.
Linking the Data to Power BI
For this part of the process, you will need to launch the Power BI desktop. If you have not, simply go to powerbi.microsoft.com, log in, and download Power BI before you follow the steps in this section. We will be linking the analysis server to PowerBI.
To attach the data source in PowerBI:
- Open the Power BI desktop.
- Click Get Data.
- Choose Database.
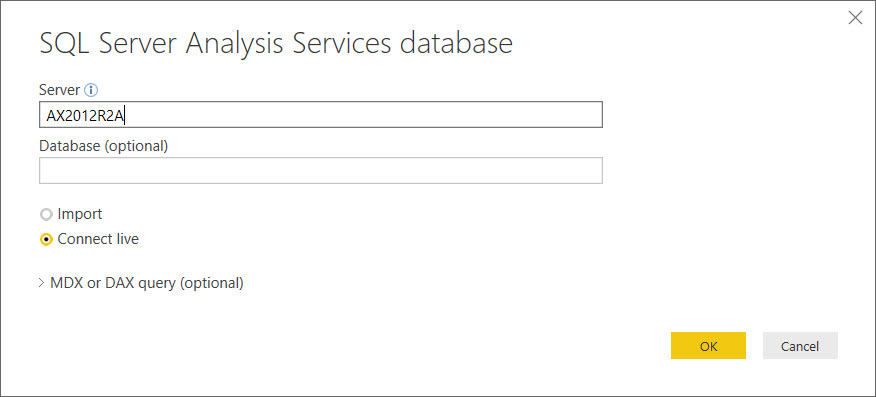
- Select SQL Server Analysis Services database.
- Click Connect
- Enter your server name in the Server In the demo database the server is typically called AX2012R2A.
- Click OK.
- Select Dynamics AX initial.
- Click Accounts payable cube.
- Click OK.
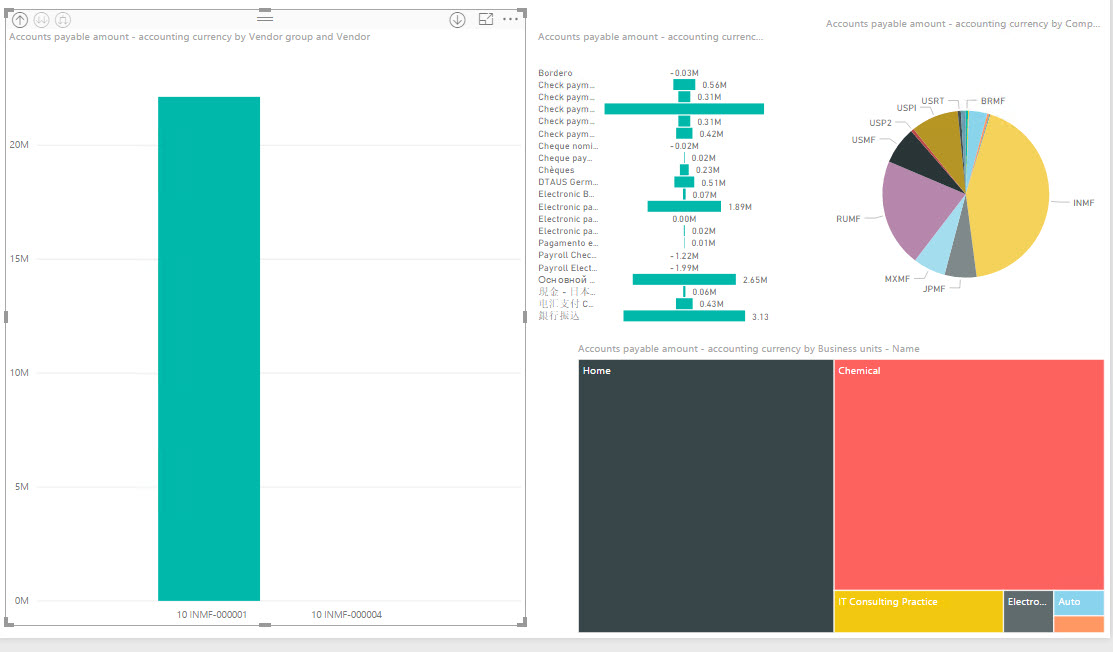
Sample Visualizations
We are now ready to render the data in PowerBI. Since we are now using direct data you will notice that there is no Data or Relationship views. These are removed because the data cannot be manipulated using this type of connection.
To create sample visualizations:
- Click the Stacked column chart
- From Vendor, drag Vendor group – vendor to Axis.
- From Vendor transactions, drag Accounts payable amount – accounting currency to Value.
- Click off the visualization.
- Click the Funnel
- From Methods of payment – vendor, drag Methods of payment vendor to Group.
- From Vendor transactions, drag Accounts payable amount – accounting currency to Values.
- Under Filters, select Accounts payable amount – accounting currency to Select all and remove the N/A values.
- Click off the visualization.
- Click the Pie chart
- From Company, drag Company to
- From Vendor transactions, drag Accounts payable amount – accounting currency to Values.
- Click off the visualization.
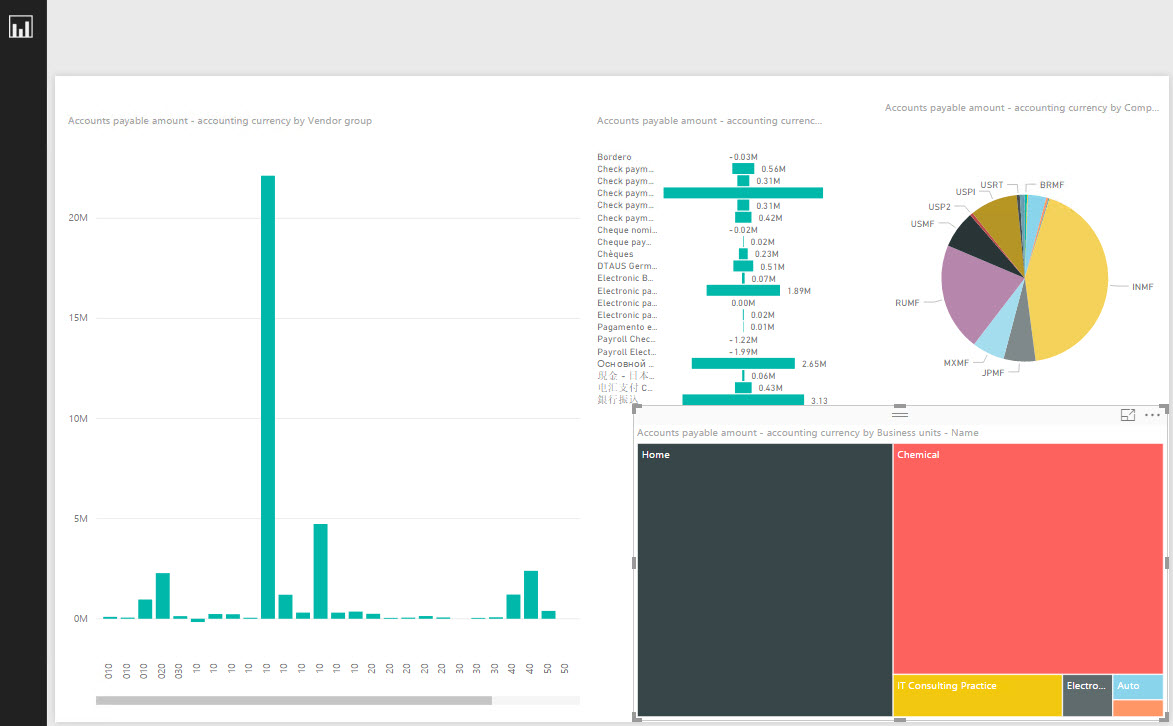
- Click the Tree map
- From Business units, drag Business units – Name.
- From Vendor transactions, drag Accounts payable amount – accounting currency to Values. Here is a finished view.
- Now click into the visualizations to see the interaction. For example, in the main visualization: Amount by currency, Vendor group, and Vendor, right click Vendor group 10 and use the drill down. Here is a sample.
Conclusion
This article explored the process of using the AX2012 Cubes for a data set and visualizations. In this exercise we reviewed the process of refreshing the data in the cubes, linked PowerBI to the data set, and created a sample set of visualizations. Our goal was to render AX2012 analytical data for use in PowerBI to create interactive graphs and charts visually explain payment methods, vendor groups, and business units all within a dashboard. This process can be used for those who are currently on AX2012 and for those companies that have recently switched to Microsoft Dynamics 365 for Finance and Operations, Enterprise edition and still need access to their AX2012 Cube data.
For more information, I would recommend that you attend our Power BI training in person or on-demand online to learn more.
Keep an eye out for more articles that dive into the technical aspects of PowerBI DAX language and X++ coding. Visit http://academy.rsmus.com for more information and training materials that will cover this and hundreds of other topics for PowerBI, AX2012, and MsDyn365.
by Shaun McMikle for RSM
RSM Staff
RSM empowers middle market companies worldwide to take charge of change. Our unique middle market perspective makes RSM the natural choice for growth-oriented, internationally active organizations seeking relevant insights and tailored, innovative solutions for a complex and changing world. With a global reach spanning more than 120 countries, we instill confidence in a world of change by bringing the full power of RSM to make a lasting impact on our clients, colleagues and communities.