There are many different options when it comes to data sources with Power BI. In Part 1: Embedding Power BI reports in SharePoint, I explained how to embed a Power BI tile on a SharePoint Online site using data from an excel spreadsheet. Another option is to use data from a SharePoint list. This option can be valuable to any team because you are no longer displaying static data. The information that will be displayed on the new Power BI report will be derived from live, dynamic data created through the power of collaboration that SharePoint provides.
In order to connect to a SharePoint list with Power BI, you will need to download Power BI Desktop.
- Once you are in Power BI Desktop, click Sign in and sign in with your Office 365 credentials.
- To connect to a SharePoint list, click the Get Data drop down and then select More…

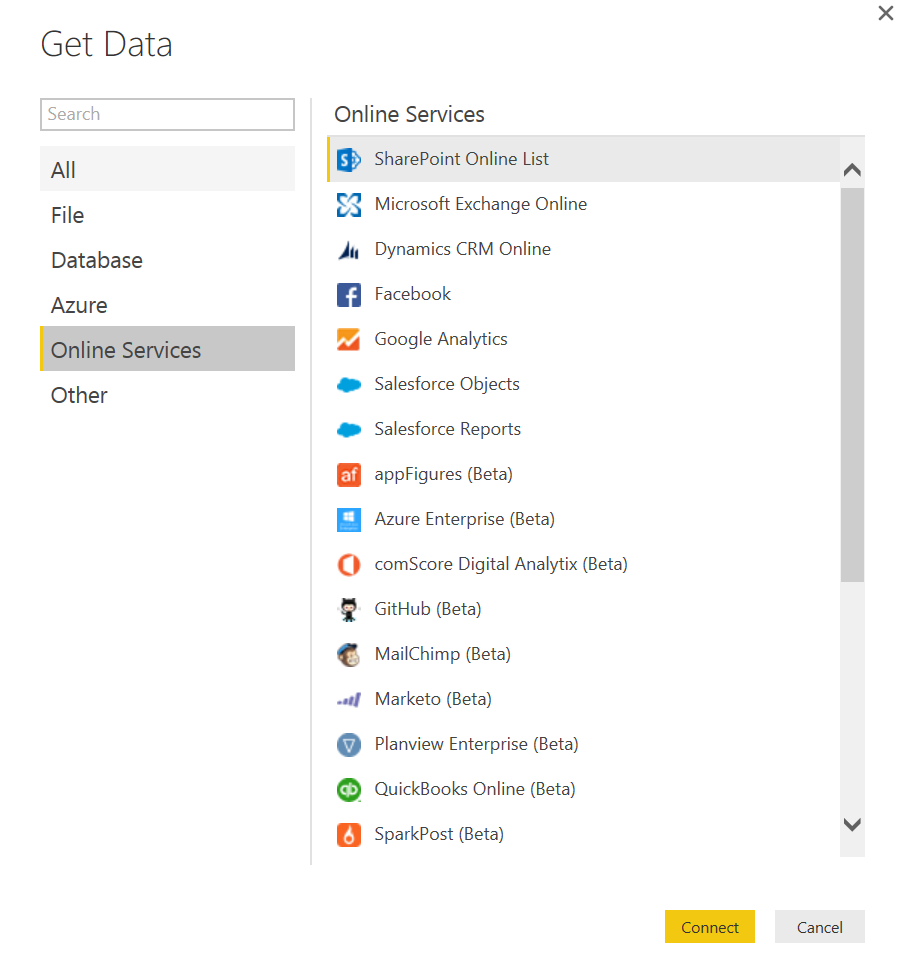
3. Select Online Services and click on SharePoint Online List and Connect.

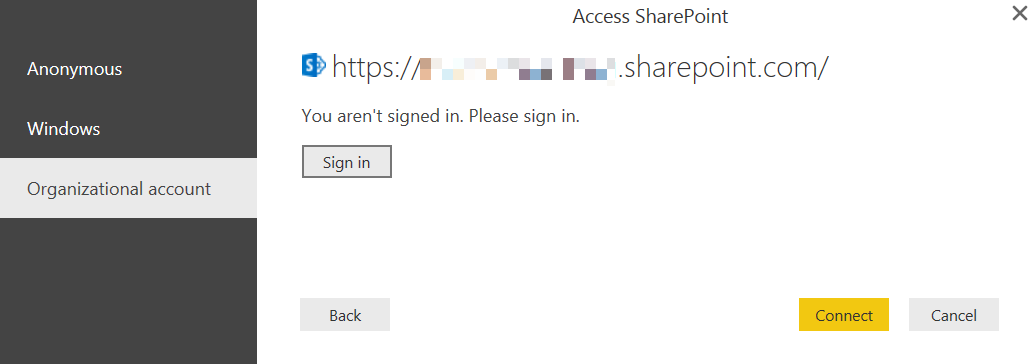
4. Enter the URL for your SharePoint Site.
5. Select Organizational account and use your Office 365 credentials to access your SharePoint Online site.

6. Click Connect and select the list you wish to use – I am using a list called “Sales Data”
7. Click Load.
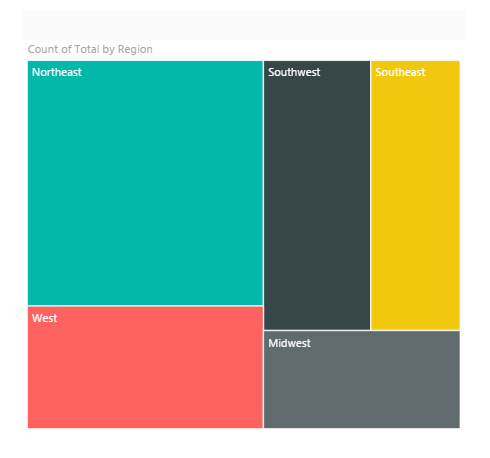
8. Select the visualization you want to use – I chose to use a Treemap to visualize Total Sales by Region.
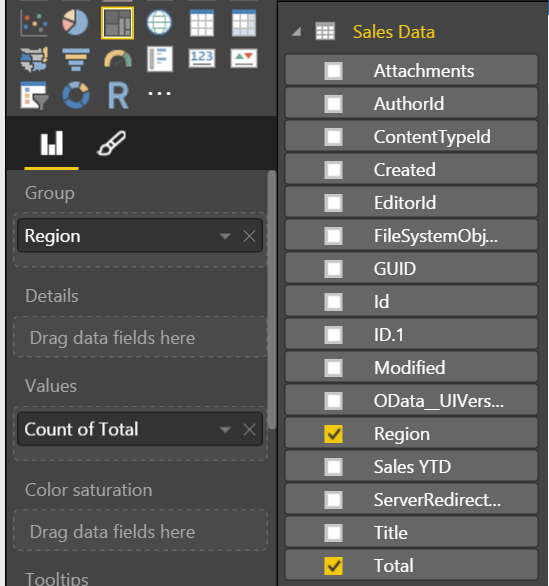
9.Choose the fields you want to display


10. Save the file and click Publish
Open up Power BI in Office 365 and you will notice that the dataset and report you published in Power BI desktop have been automatically created.
To find out more about this or other ways that RSM can assist you with your Microsoft solution needs, contact RSM’s technology consulting professionals at 800.274.3978 or email us.

 RSMUS.com