When working with Power BI, a great way to test the functionality is to attach your desktop to a sample SQL database hosted in Azure. The dataset that we will be using is called AdventureWorks. This is familiar to many programmers as Microsoft has reused this example many times for different programming techniques. This article is the continuation of a series on Power BI and the capabilities of the product. The purpose of this exercise is go into Azure, spin up the database, configure the access, and attach the database to Power BI. Then, we will use the data to quickly model a sample page that can be published to PowerBi.com. The assumption of this article is that you already have an Azure Active Directory account that is tied to your Power BI account. In addition, it assumes that you have already downloaded the local desktop version of Power BI.
Set up an Azure Subscription
The first step is to log in to Azure with your credentials. For this example, we are using the new Azure portal, which is different from the Azure classic environment.
The database structure in Azure requires a payment method, which you select when you set up a subscription. If you have a Visual Studio license or MCT professional certification, these will provide you with a monthly budget of $50 for testing.
To log in to Azure and set up a subscription:
- Open your browser and navigate to https://portal.azure.com.
- Log in to Azure using your AAD credentials for PowerBI.
- Click Billing.
- Click Subscriptions.
- Click New subscription.
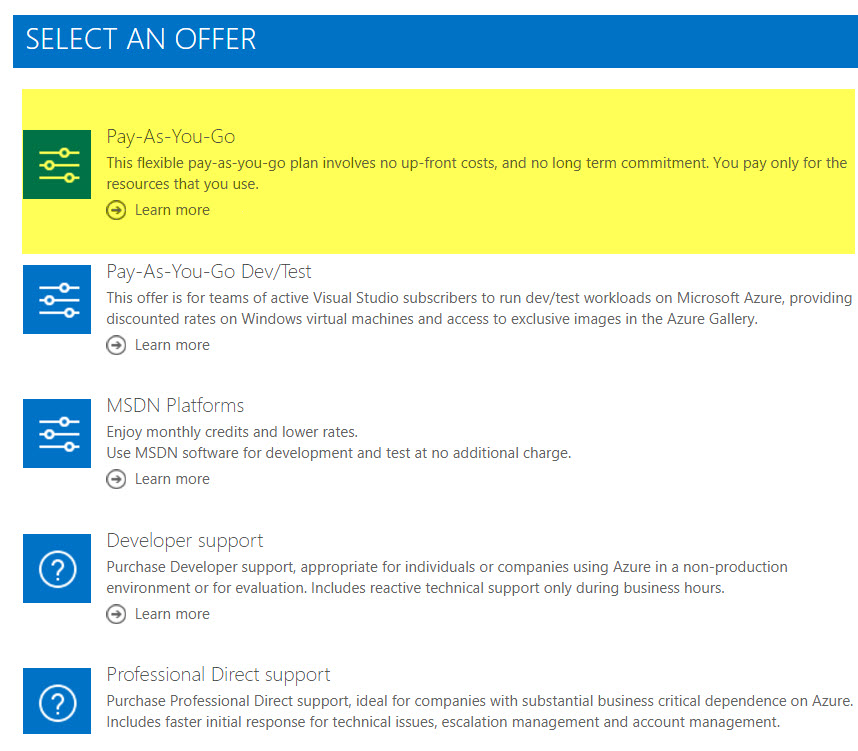
- Choose the subscription that best fits your requirements. For our purposes you can use Pay-As-You-Go or use your Visual Studio Professional license. Fill in the required billing information and complete the subscription process.

- Once you have a subscription, exit billing.
Set up an Azure Sample Database
The next step is to set up the database using the wizard. This guides you through the choices that are possible. It is important to name the database with something that you can both remember and find again. Using the date of creation and your initials will help ensure that no two databases have similar names.
To set up the database:
- In Azure, click SQL Databases.
- Click Add.
- Enter a name for the database. For our demonstration, we will use the name rsmSampleAdventure08312017spm.
- Select the subscription you created earlier.
- Select Create new under Resource Group.
- In the Name field, enter MyResourceGroup.
- Select Sample (AdventureWorksLT) in the Select source
- Click Server.
- Click Create a new server.
- Enter the following information:
- Server name: sys08312017-demo-spm
- Server admin login: administrator08312017
- Password: For this field, we suggest pa$$w0rd. Ensure you write down the password.
- Select a location.
- Click Select.
- Select Not now in the Want to use SQL elastic pool
- Click Pricing Tier.
- Select Basic.
Note: The default pricing tier is Standard S2; however, this option will consume more resources and incur more costs than needed for the demo database.
- Click Apply.
- Click Create.
- There will be a notification that the setup is completed. Once complete, you will receive notification of deployment.
- Click Refresh on your SQL databases
- Select the database that you created.
- Click Database.
- Click Properties.
- Under Server Name, click Copy to clipboard.
- Leave the Azure page open.
Running Power BI and Connecting the Database
For this part of the process, you will need to launch the Power BI desktop. If you have not, simply go to powerbi.microsoft.com, log in, and download Power BI before you follow the steps in this section.
To attach the data source in PowerBI:
- Open the Power BI desktop.
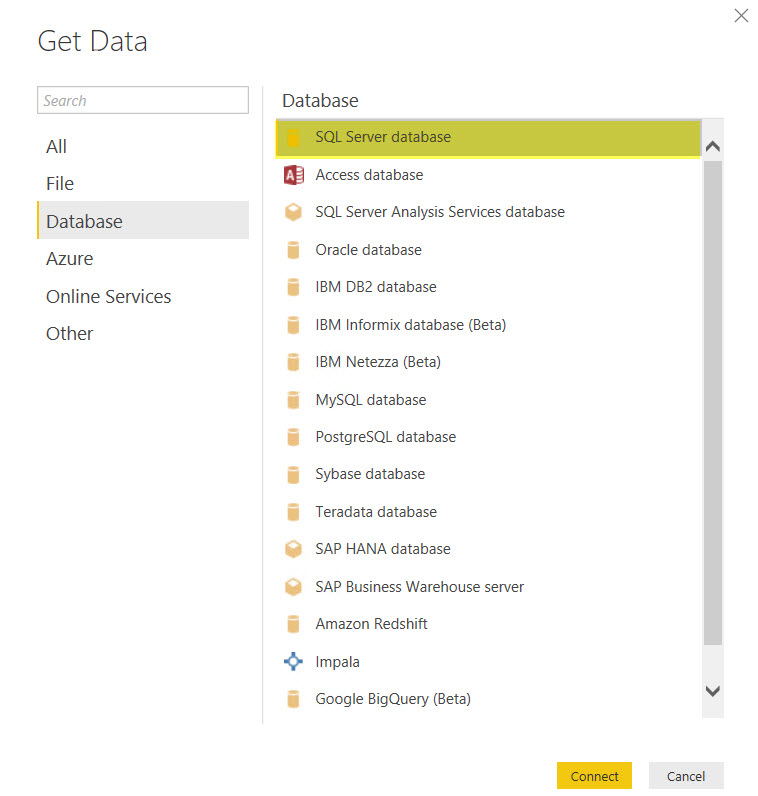
- Click Get Data.
- Choose Database.
- Select SQL Server database

- Click Connect
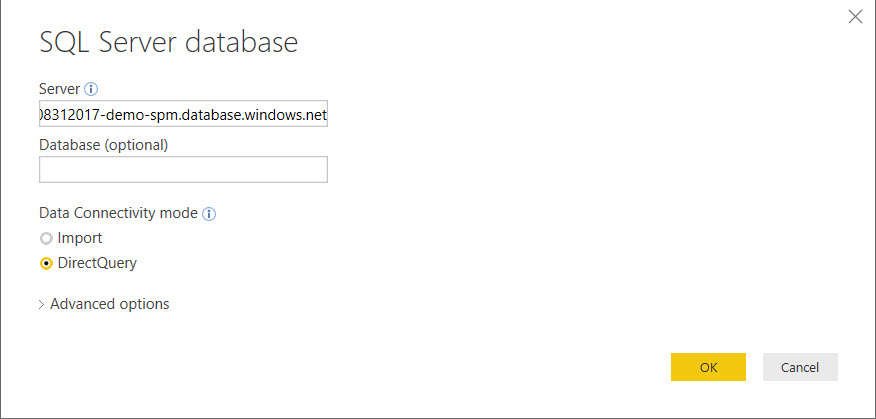
- Enter your server name in the Server field

- Click OK.
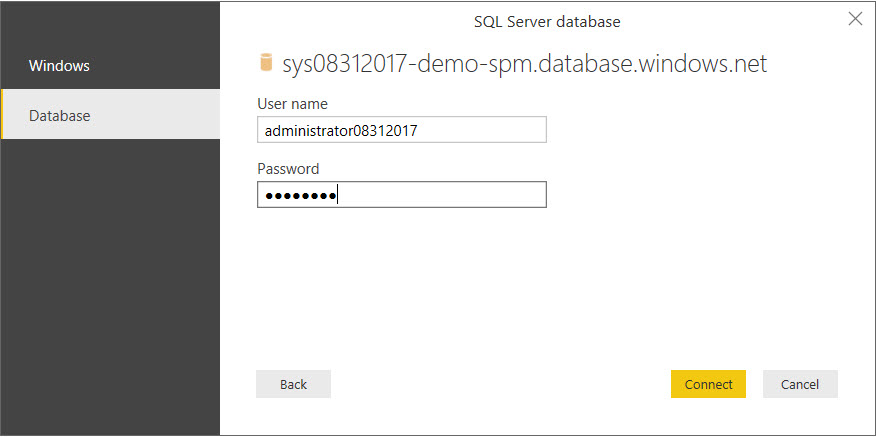
- Click Database.
- In the Azure website, copy the server admin login user name.
- In Power BI, paste the user name into the User name field

- Enter the password you created earlier.
- Click Connect.
- Select the database name.
- Click Product.
- Click Load.
Rendering in Power BI
Finally, we are ready to test our connected tables.
To create sample visualizations:
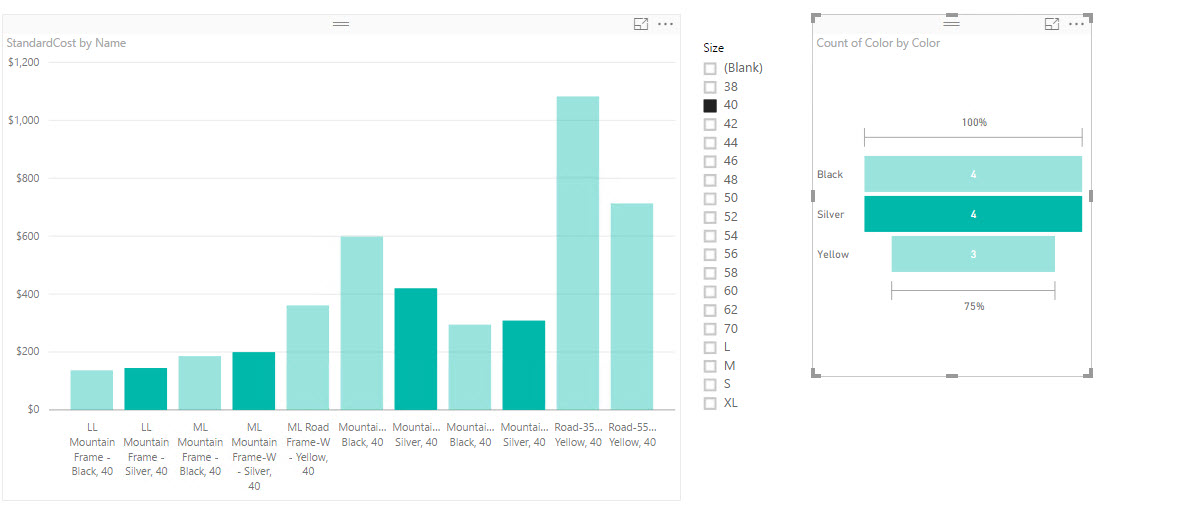
- Click the stacked column chart visualization.
- Drag Name to Axis.
- Drag StandardCost to Value.
- Click the slicer visualization.
- Drag Size to Field.
- Click the slicer visualization.
- Click the funnel visualization.
- Drag Color to Group.
- Drag Color to Values.
- Now click into the visualization to see the interaction.

Conclusion
This article explored the process of creating a sample Azure database. First, we set up the Azure subscription. Then, we created the database, connected to the database, and rendered visualizations based on a table. The Adventureworks data gives you the ability to test theories, provide proof of concept, and to model with a simple dataset before taking on other pieces.
For more information, I would recommend that you attend our Power BI training in person or on-demand online to learn more.
Plus keep an eye out for more articles that dive in to the technical aspects of PowerBI DAX language and X++ coding. Visit academy.rsmus.com for more information and training materials that will cover this and hundreds of other topics for PowerBI, AX2012, and MsDyn365.
by Shaun McMikle for RSM

 RSMUS.com