If possible, run the long running process in a testing/performance environment where there are not several other processes running at the same time.
Open Tools | Tracing cockpit. Mark the Bind parameters checkbox and accept the Default values for the rest of the parameters as follows:
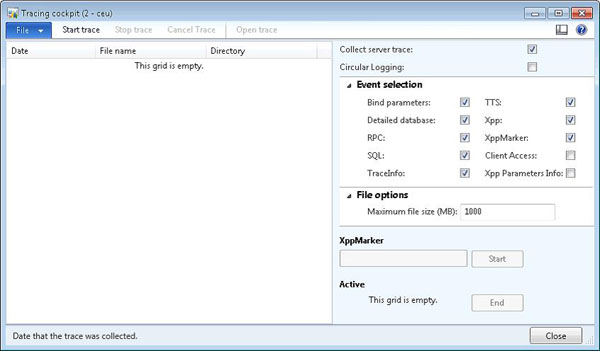
Click on Start trace and save the trace file to read, C:tempprocessnametrace.etl.
Run the process with the performance problem.
Now, in the Tracing Cockpit form, click on Stop Trace:
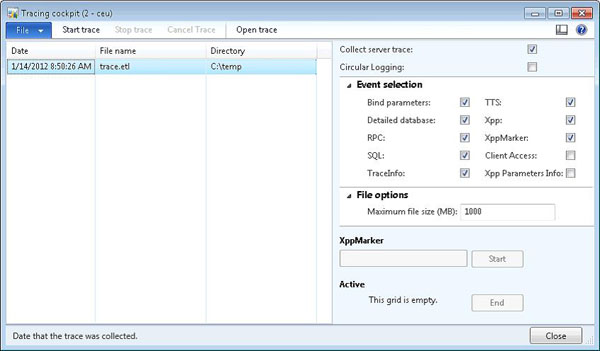
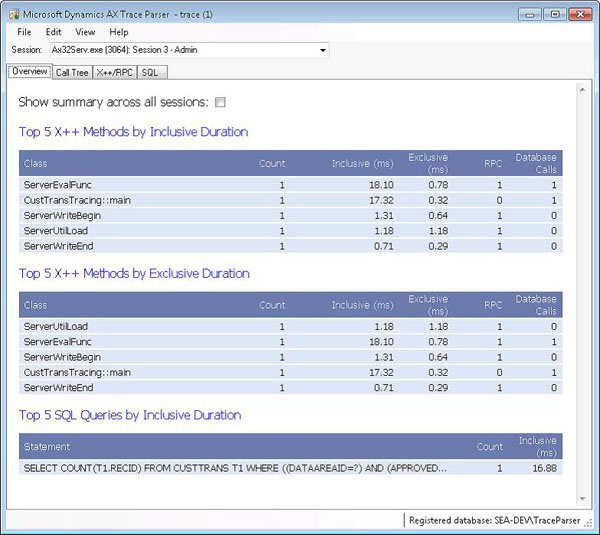
Open Microsoft Dynamics AX 2012 Trace Parser, import the previously saved trace file, and select your session in the Session field at the top:
Open the SQL tab page. The query should be displayed here. If there are too many records, apply the filter by typing the table name into the Name Filter field, and by marking the Show Tables checkbox to find your query:
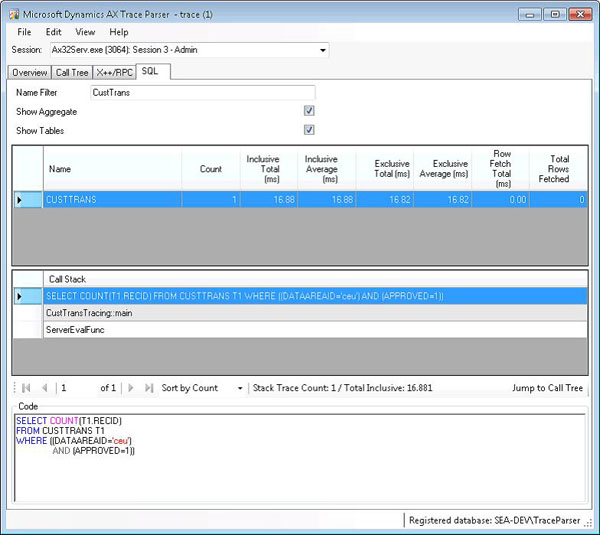
Click on Jump to Call Tree to display the query in the call stack:
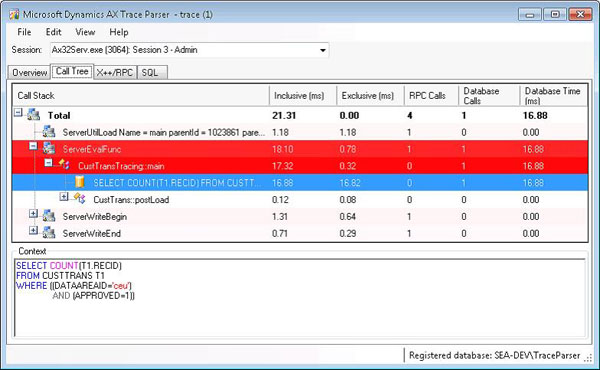
If it is possible, locate the SQL statement in the call stack by clicking on the Jump to Call Tree button. This view shows the code in question in the context of other processes.

 RSMUS.com