
 RSMUS.com
One of the continuing ways to extract data from Microsoft Dynamics 365 for Finance and Operation, Enterprise edition is to use the export function. For our purposes, we will be using data that we render using a Pivot Table in Microsoft Excel 2016. This article is based on an earlier TechNet series on the same topic for Microsoft Dynamics AX 2012; I have updated for the tools and menus that you see today. In this exercise, we will be extracting data from a list page into Excel, importing data into PowerPivot using an OData feed, and creating a Pivot Table from the output.
This is part two of a four-part series on this topic. Part one was an updated walk-through of this process for AX 2012. Two of the series are on Dynamics AX 2012 and two are on Dynamics 365 for Finance and Operations, Enterprise edition. Each time we are modeling the same tools only using different connections and a bit different data. The purpose of this is to support both groups of implementations and to transition you quickly to the new Dynamics 365 for Finance and Operations, Enterprise edition tools.
Extracting Data from a List Page into Excel
We will need to get our data from Dynamics 365 for Finance and Operations, Enterprise edition. One of the best methods is to harvest data from a list page. If you don’t have a list page that feeds this information, kindly ask your IT department to create one. Many of the existing list pages in Dynamics 365 for Finance and Operations, Enterprise edition do all that you would want by using personalization to find the information that you need.
To extract key data from a list page into Excel:
- Open Dynamics Dynamics 365 for Finance and Operations, Enterprise edition.
- Click the Show navigation pane
- Select Accounts receivable > Customers > All customers.
- Click Options, the last menu item. If not displayed, click the ellipses to see any menu items that are not shown.
- Click Personalize this form.

- Click the plus button.
- Click on the Customer
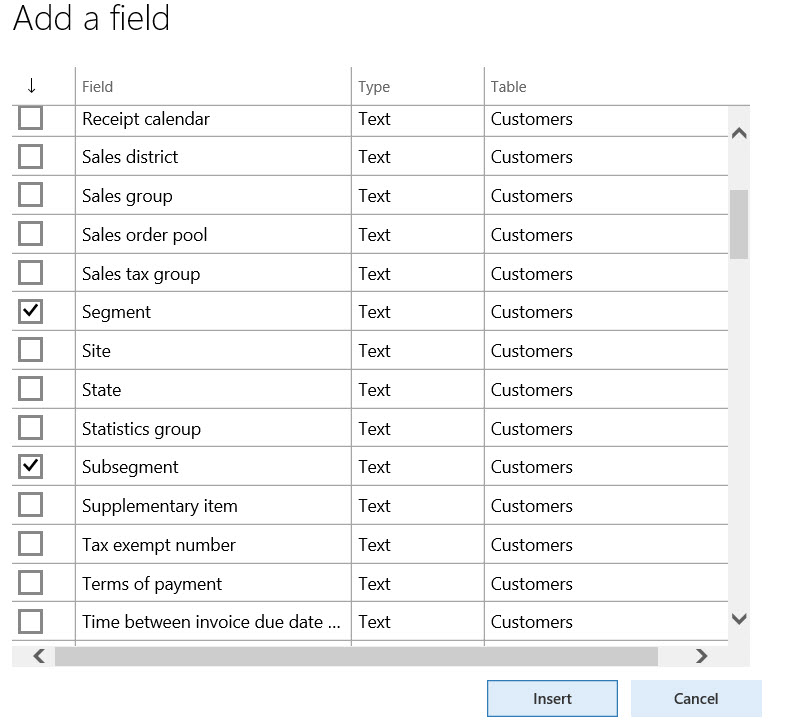
- Add the following fields from the Customers table:
- Method of Payment
- Segment
- Subsegment
- Customer classification group
- Click Insert.
- Close.
- After the All customers list page is refreshed, click Export to Microsoft Excel in the Open in Office button.
- Click Download.
- Click Open if asked by Internet Explorer settings.
- Click Enable Editing if challenged Protected View.
- File > Save as > find the desktop or where you would like to place > File name CustomerInformation > Save.

Importing Data into Power Pivot by using OData
This has been simplified for Dynamics 365 for Finance and Operations. With just a few clicks directly in the Excel 2016 Query Editor, we can access the information that we need for the demo.
To create an OData feed:
- In the same Excel workbook you used earlier in this walkthrough, click the Data
- Click Data
- Click New Query.
- Click From Other Sources > From OData Feed.
- URL, enter:
https://<YOUR SERVER NAME HERE>.cloudax.dynamics.com/data
- Click OK.
- If asked for authentication, use organizational credentials from AAD to connect.
- Choose CustomerPaymentJournalLines.
- Click Load.
Creating a Pivot Table
We are now ready to render the data in a Pivot Table. These steps will create a pivot table from the data. With a small amount of alteration, you could also render this data using a Pivot Chart.
To create a sample report:
- In Excel, click the PowerPivot
- Add to Data Model.
- Click OK.
- Click on Sheet1.
- Add to Data Model.
- Click Home
- Click Pivot Table.
- Click OK.
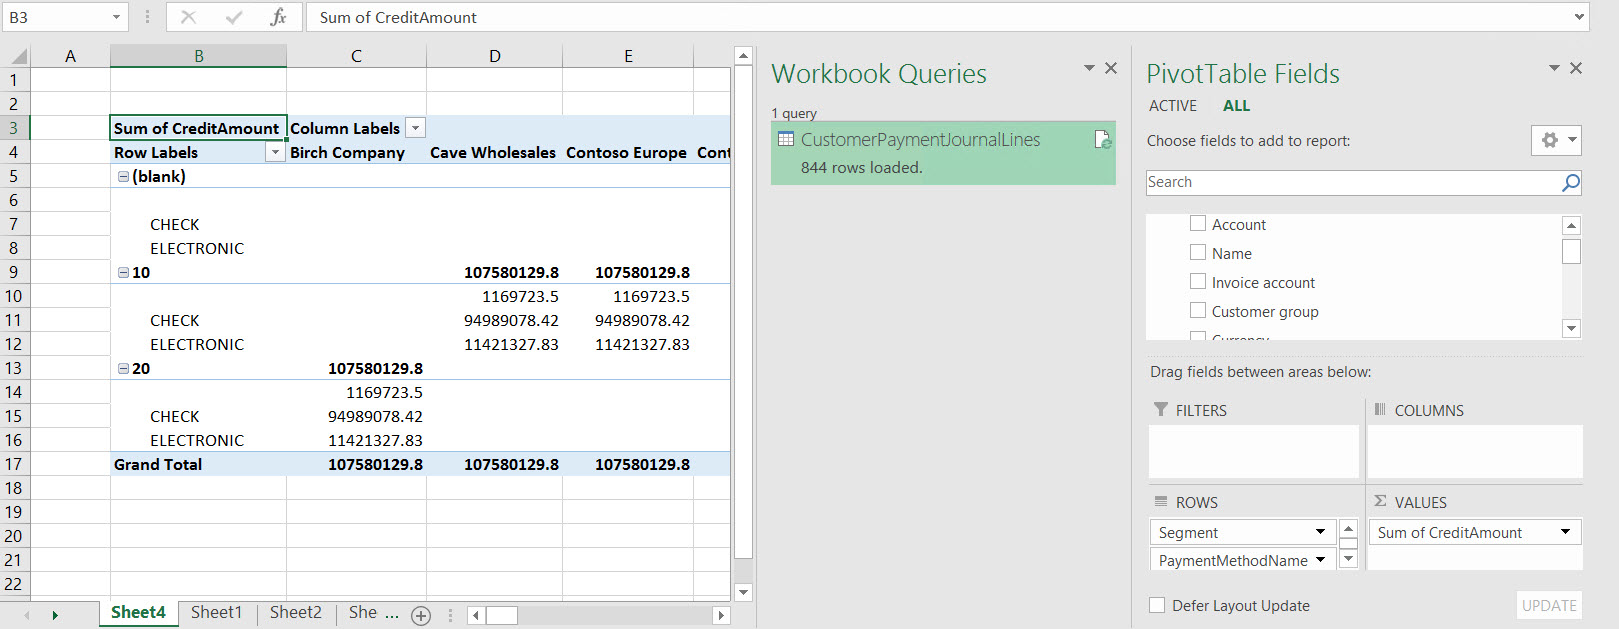
- Expand CustPaymentJournalLines and then select CreditAmount.
- Expand Table and then select Segment.
- Add PaymentMethodName to rows from CustomerPaymentJournal Lines and Add Name from AxTable to columns
- Click Analyze
- Select Insert TimeLine.
- Choose TransactionDate
- Click OK.
- Use items to interact with.
This article explored the process of using Dynamics 365 for Finance and Operations, Enterprise edition to visualize data within a Pivot Table, which can be easily be translated to a Pivot Chart. In this exercise, we extracted the data from a list page into Excel, imported data into PowerPivot using an OData feed, and created a Pivot Table from the output. Through the process of creating several different renderings of the data, you can quickly interact with the set of information and create inferences for decision making.
For more information, I would recommend that you attend our Dynamics AX 2012 or Dynamics 365 for Finance and Operations, Enterprise edition training in person or on-demand online to learn more.
Plus, keep an eye out for more articles that dive into the technical aspects of using Excel, X++ code, and PowerBI. Please visit academy.rsmus.com for more information and training materials that will cover this and 100’s of other topics for AX 2012 and Dynamics 365 for Finance and Operations, Enterprise edition.
by Shaun McMikle for RSM
RSM Staff
RSM empowers middle market companies worldwide to take charge of change. Our unique middle market perspective makes RSM the natural choice for growth-oriented, internationally active organizations seeking relevant insights and tailored, innovative solutions for a complex and changing world. With a global reach spanning more than 120 countries, we instill confidence in a world of change by bringing the full power of RSM to make a lasting impact on our clients, colleagues and communities.