Businesses and users will have requirements to combine various data sets for ad-hoc reporting needs. These data sets could include various source environments or a single source environment such as Dynamics 365 with disparate data. A power user of these systems will need a way to query and report on this disparate data to meet business and management needs.
Excel Power Query and Power Pivot are robust tools within Excel that allow users to connect to data from external sources, arrange data from multiple sources into a singular data model, and analyze that model all at once within Excel. Without Power Pivot, users would have to manage multiple worksheets of data and perform lookups to manually arrange the data. With Power Query and Power Pivot, all this work is done by the application and can be refreshed with real-time data.
For Dynamics 365 users, Power Pivot is useful for querying multiple data entities into the same data model to analyze it all at once. For example, if there is a requirement to see invoiced sales line totals by item group and customer group, that is four different data entities (SalesOrderLines, ReleasedProductsV2, SalesOrderHeaders, and CustomersV3). Manually exporting these entities and arranging the data would be tedious, and it would have to be re-done every time new data is needed.
In this article, we will go over how to use Power Query and Power Pivot with Dynamics 365 data for the invoiced sales line totals by item group and customer group as described above.
NOTE: Power BI is another tool commonly used to surface data from Dynamics 365 and is often a better tool for querying and reporting. Some organizations may not have Power BI licenses, however, and users may be more proficient in Excel.
Enabling the Power Pivot Add-in for Excel
First, the Power Pivot add-in should be enabled for Excel.
- In Excel, click File > Options > Add-ins
- In the Manage box, select “COM Add-ins” and click Go
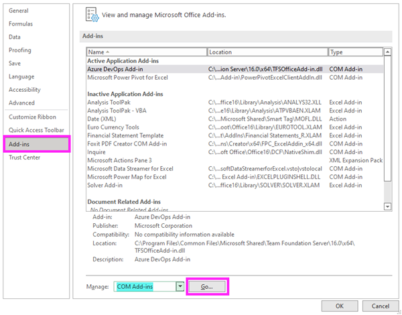
3. Check the box for Power Pivot and click OK.
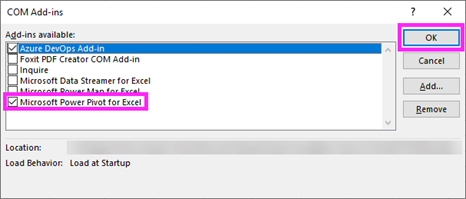
4. You should now see a tab at the top of Excel for Power Pivot

Query Data from D365
Now that Power Pivot is enabled, we will build a data model from D365 using Power Query.
- Click Data > Get Data > From Other Sources > From OData Feed
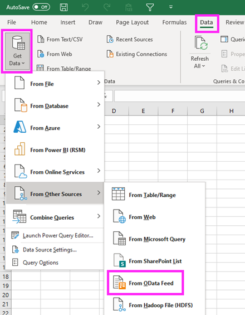
Note: Odata feeds should only be used for small data sets. Querying large data sets through Odata can be slow and cause performance issues with the Dynamics 365 environment. If large data sets are required for reporting/querying, a BYOD, Data Warehouse, and/or Data Lake should be built.
2. In the URL field, enter the URL of your D365 environment, followed by “/data.”
a. Example: yourcompany.cloudax.dynamics.com/data
b.

3. Click OK. If prompted to sign in, sign in with the “organizational account” tab and your D365 login information.
a. NOTE: the OData feed will automatically link to the user’s default company within D365. If another legal entity is needed, the OData feed can be queried to allow that. Find more information in this Microsoft article.
4. Data entities will now be selected to connect to Excel. Going back to our business scenario, we want to see a breakdown of invoiced sales lines by customer group and by item group. We need the following data entities to perform this analysis: SalesOrderLines, SalesOrderHeaders, CustomersV3, and ReleasedProductsV2.
5. In the Navigator, select the SalesOrderLines entity. Click Transform Data.
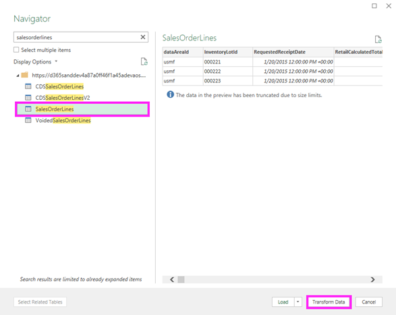
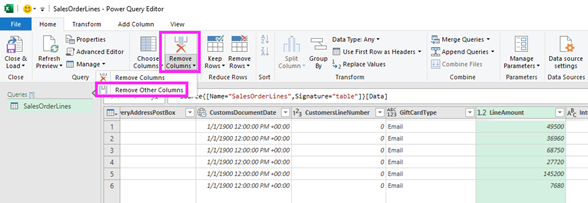
6. Columns can now be selected to bring into the data model. CTRL click to select SalesOrderLineStatus, ItemNumber, SalesOrderNumber, and LineAmount. In the Home tab, click Remove columns > Remove other columns
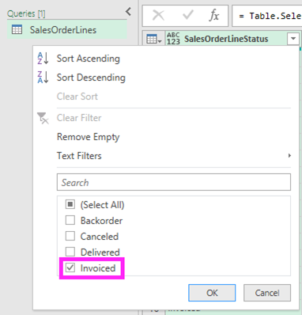
7. Now, only the desired columns are in the query. Based on our scenario, we only want to see invoiced sales lines—filter on “Invoiced” in the SalesOrderLineStatus Column.
a. NOTE: removing unwanted columns and filtering only to include needed data will improve performance. We will never need to manually filter on the “Invoiced” status in the workbook itself after setting up this query.
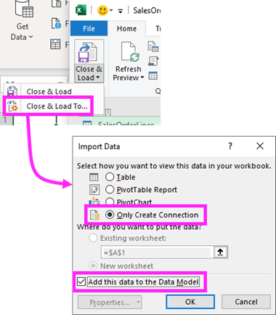
8. We have everything we need from the sales order lines entity. Click Close, Load > Close, and Load To…
a. Click Only Create Connection, and ensure the Add this to the data model check box is enabled
9. Now that we have added sales order lines to the data model, we need to do the same for sales order headers, customers, and released products.
a. Repeat the same steps for each additional entity that needs to be added to the data model (get data, select columns, filter, add to data model). Below are the entities and fields that need to be added:
i. SalesOrderHeadersV2 – Sales order number, ordering customer account
ii. CustomersV3 – Customer account, customer group ID
iii. ReleasedProductsV2 – Item number, product group ID
Create a Power Pivot with the existing data model
Data will be analyzed with Power Pivot now that we have added the data entities above to the data model.
- In the Power Pivot tab in Excel, click Manage

2. This will open a window with your data model. There will be a tab for each query. In the Home tab, click Diagram view.
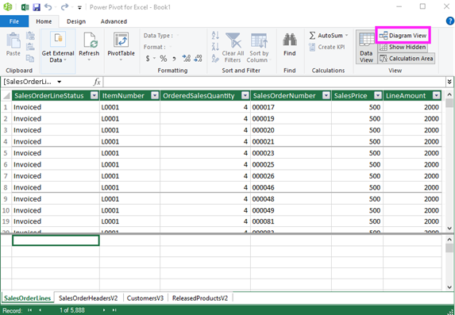
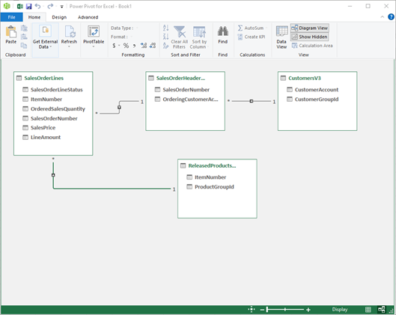
3. Diagram view will show the data sources and their individual fields. Here we can create relationships between the entities by drawing lines between the fields. Draw lines to create relationships between the following fields
a. Sales order number (the line between sales order lines and sales order headers entities)
b. Customer account (the line between sales order headers and customers entities)
c. Item number (the line between sales order lines and released products entities)
4. When finished creating relationships, the diagram below visualizes the relationships:
5. In the Home tab, click Pivot table to create a pivot table from our data model.
6. Now we have available pivot table fields from all four data entities:
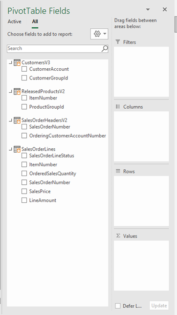
7. To fulfill our business scenario of seeing sales line totals by item group by customer group, add item group and customer group to the rows section, and add line amount to the values section. Our pivot table shows a summary of sales line totals by item and customer group.
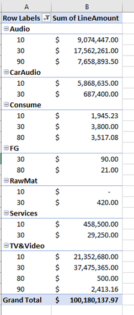
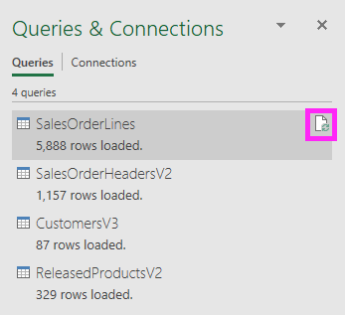
Now any time updated values are needed for this data, the file can be opened, and the data refreshed with the click of a button.
This is just one example of how Power Pivot can be used with D365. There are many cases where data comes from multiple entities but needs to be analyzed together. Power Pivot offers a robust solution and a much-needed alternative to manual excel lookups from multiple sources.
Please contact us here if you have any questions or visit our website to learn more.

 RSMUS.com