Optimizing your business’s potential involves seamlessly blending accounting and inventory functionalities. Imagine effortlessly tracking asset values and calculating profits. Welcome to the realm of NetSuite, where your account transforms into a powerhouse for monitoring inventory costs – those crucial expenses tied to the goods and services you provide.
Every time you buy and sell inventory items, meticulous tracking of costs becomes imperative throughout the purchase and sales processes. The cost of an item you purchase or sell directly impacts accounts in your general ledger. Although not an expense account, the Cost of Goods Sold (COGS) account functions like one. When computing your company’s gross profit, the total inventory cost is subtracted from the overall income total before factoring in expenses.
NetSuite Costing Methods:
Let’s delve into the common costing methods available in NetSuite:
Average Costing:
It is calculated as the total units available during a specific date range, divided by the beginning inventory cost plus the cost of additions to inventory. This method employs the moving average method, averaging costs over the period.
In the example, NetSuite calculates the average cost by dividing the total inventory value by the number of units available for sale. For instance, with Purchase 1 at $100 and Purchase 2 at $200, the average cost per item is $15.
|
Type |
QTY |
Rate |
COGS |
AMOUNT |
| Purchase 1 | 10 | 10 | 100 | |
| Purchase 2 | 10 | 20 | 200 | |
| Total | 20 | 300 | ||
| Average cost Per Item | 300/20=15 | |||
| Sales 1 | 5 | 18 | 5×15=75 | 90 |
| Net Inventory Value | 20-5=15 | 15 Average per item | 15X15=225 |
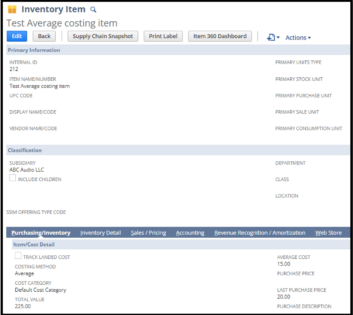
This example shows that NetSuite calculates the average cost by dividing the total inventory value by the number of units available for sale.
Purchase 1 is $100, and Purchase 2 is $200; the total units purchased are 20, so the average cost per item is $15.
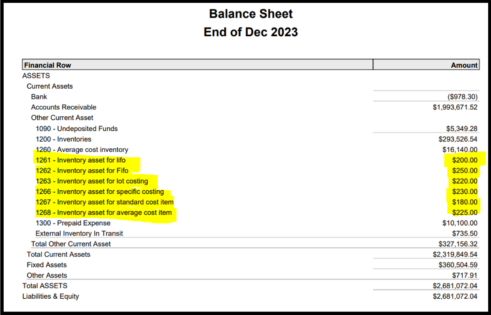
When we sell 5 Qty, the system understands that 5 Quantity out of 20 were sold, the Net quantity is 15, each costing $15. Hence, the inventory value in the warehouse is $225, which you can see on the balance sheet under the Other Current Assets account.
FIFO (First in First Out):
Assumes the first goods purchased are the first goods sold. This method is beneficial for tracking different shipments of similar products. The FIFO method is typically used to manage perishable product stock with an expiration date, the most common being food, medicine, and cosmetic products.
The system understands that five quantities were sold from Purchase 1 in the example. Thus, 5 (5X10=50) are left from Purchase 1, and 10 (10X20=200) are left from Purchase 2, making the total inventory value in the warehouse $250.
| Type | QTY | Rate | COGS | AMOUNT |
| Purchase 1 | 10 | 10 | 100 | |
| Purchase 2 | 10 | 20 | 200 | |
| Total | 20 | 300 | ||
| Sales 1 | 5 | 18 | 5×10=50 | 90 (Sales) |
| Net Inventory Value | 20-5(First 5 sold) = 15 | (5×10) +(10X20) | 250 |
In this example, the system understands that quantity five was sold from Purchase 1. Hence, with 5 (5X10=50) Left from Purchase 1 and 10 (10X20=200) left from Purchase 2, the total inventory value will be 250 in the warehouse.
LIFO – (Last in First Out):
In the Last In, First Out (LIFO) inventory costing method, the concept is that the most recently acquired goods are considered the first to be sold. Consequently, the ending inventory on the balance sheet comprises the earliest goods obtained. Companies adopting LIFO prioritize selling the inventory from their most recent purchases. An example of this practice can be observed in businesses like wine distributors.
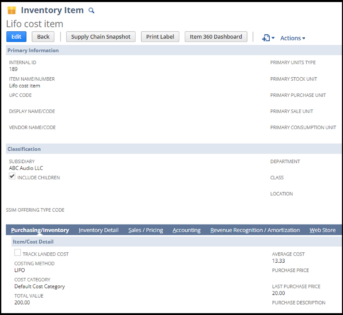
As illustrated, the system comprehends that five quantities were sold from the last purchase, which cost $20 per item. The remaining five are left in the warehouse, and ten from the first purchase, totaling an inventory value of (10X10=100) + (5X20=100) $200.
| Type | QTY | Rate | COGS | AMOUNT |
| Purchase 1 | 10 | 10 | 100 | |
| Purchase 2 | 10 | 20 | 200 | |
| Total | 20 | 300 | ||
| Sales 1 | 5 | 18 | 5×20=100 | 90 (Sales) |
| Net Inventory Value | 20-5(First 5 sold) = 15 | (10×10) +(5X20) | 200 |
As shown in the above example, the System understood that we sold five quantities from the last purchase, which cost $20 per Item, and the remaining five are left in the warehouse, and ten from the first purchase total inventory value in the warehouse is (10X10=100) + (5X20=100) $200.
LOT – For Lot items:
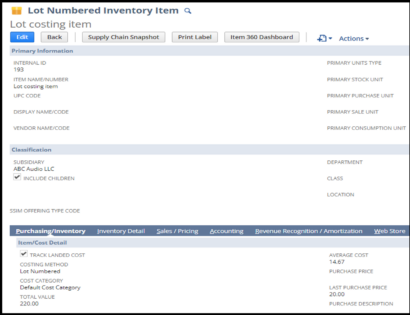
Monitors the acquisition, storage, and sale of a set or quantity of items by assigning a distinct number to the group or quantity. This is particularly beneficial for businesses involved in handling items in lots.
- When employing LOT costing methods, the system guides users in designating the lot number during receipt and shipment of items.
| Type | QTY | Rate | COGS | AMOUNT | Inventory Details |
| Purchase 1 | 10 | 10 | 100 | Lot 1 | |
| Purchase 2 | 10 | 20 | 200 | Lot 2 | |
| Total | 20 | 300 | (Lot 1 & Lot 2) | ||
| Sales 1 | 5 | 18 | (2×10) + (3X20) = 80 | 90 (Sales) | 2 from Lot 1 and 3 from Lot 2 |
| Net Inventory Value | 20-5(from 2 lots) | 220 | 220 (8 from Lot 1, and 7 from Lot2) |
As shown above, while using LOT costing methods, the system will ask you to choose the lot number while receiving and shipping the items. Based on the LOT number we enter system takes the cost. We sold 5 quantities from both Lot 1 & Lot 2. Sold value is 2 from Lot 1 (2×10=20) & 3 Lot 2 (3X0) $80. The value of the remaining items in the warehouse from both lots will be 220.
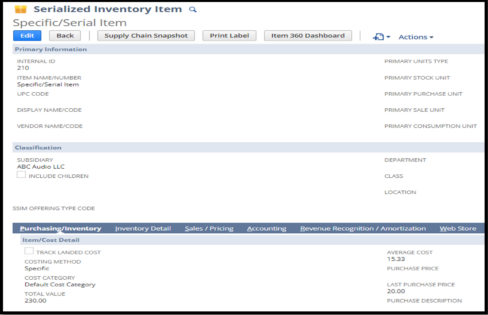
Specific Costing – Serialized Inventory Items: The exact cost of a serial number is entered into the system under inventory details on item receipt and shipment transactions. Firms who purchase and sell serial items prefer this costing method.
| Type | Qty | Purchase Price | Amount | COGS Amount | Inventory Details |
| Purchase 1 | 10 | 10 | 100 | SL 1 to SL10 | |
| Purchase 2 | 10 | 20 | 200 | SL11 to SL 20 | |
| Total | 20 | 300 | (SL1 to SL20) | ||
| Sold Qty | Sales price | Sales Amount | COGS | Serials Numbers sold | |
| Sales | 5 | 18 | 90 | 10+10+10+20+20 | SL1, SL5, SL10, SL15, SL20 |
| Net inventory Value | 20-5(Qty. 5 sold) = 15 | -70 | 230 (SL2, SL3, SL4, SL6, SL7, SL8l SL9, SL11, SL12, Sl13, SL14, SL16, SL17, SL18, SL19) | ||
As shown above, the system will consider the cost of the sold item based on the serial number of the items being sold. Here, we are selling serial numbers SL1, SL5, SL10, SL15, and SL20, and their cost respectively 10+10+10+20+20. Total COGS is 70. The inventory value of the remaining serial numbers of items in the warehouse is $230.
Standard Costing:
This costing method lets you track standard item costs and variances between these expected and actual costs. It also lets manufacturers and wholesale distributors identify and correct problems with inventory costing issues by giving information about costing variances and their causes.
You maintain standard costs across cost categories for an item using standard costing. These standard costs identify the expenses you expect to incur for their overtime. Keeping track of the expected cost lets you compare that amount to the item cost. You can then analyze any variances between the standard (Expected) cost and the actual cost of items.
Standard costing not only tells you that a variance occurs, but it also helps you understand why costs are different from what was expected. Variances might be caused by changes in how much you pay for the material or the quantity of material used.
- Purchase price variances are generated during the procurement process.
- Production quantity and cost variances are generated during the production process.
- Unbuilt variances are generated during the disassembly process.
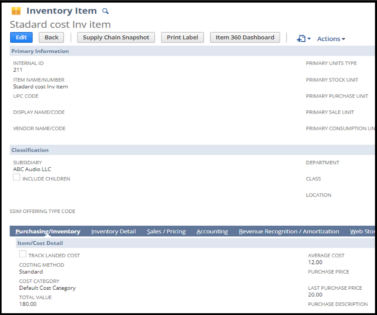
When we use the Standard costing method, the system ignores the purchase price, last purchase price, average cost, landed cost, etc. It considers Default cost only, which is mentioned on the item record.
This example shows that item value will always remain $12 per item, though you purchase it for $10 or $20.
| Type | Qty | Rate | Standard Cost on Item | Amount |
| Purchase 1 | 10 | 10 | 12 | 120 |
| Purchase 2 | 10 | 20 | 12 | 120 |
| Total | 20 | 240 | ||
| Inventory Value | 20X12=240 | 240 | ||
| Sold Qty | Sales price | Sales Amount | COGS Amount | |
| Sales | 5 | 18 | 90 | 5X12=60 |
| Net inventory Value | 20-5=15 | 15 | -60 | 15X12=180 |
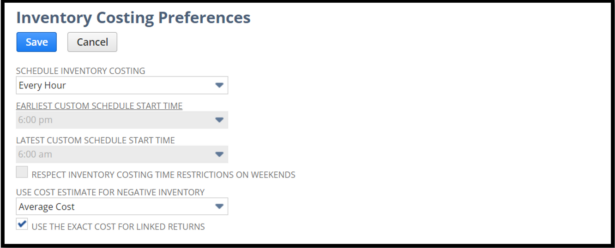
Once you save the transaction and immediately check the inventory value on the item records, the transactions, or the balance sheet, you will see different figures due to the delay of the NetSuite cost engine timing. We need to wait for the next 1 hour as the cost engine runs 1 per every hour. This time depends on the time zone of the company master.
Costing Setup:
Default Costing Method Setup under accounting preferences. –
Navigation: Go to Setup > Accounting > Accounting Preferences > Item/Transactions>Cost Accounting

Costing Preferences
Go to Setup > Accounting > Inventory Costing Preferences:
Item Master Setup: Go to Lists>Accounting>Items>New>Inventory Item (Also validate the inventory value below on each item record)
Validation:
Review inventory balance – After 1 hour of transaction entry, please review the item’s inventory value.
GL Impact from item receipt 1.
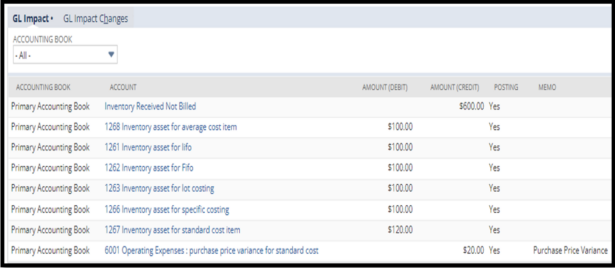
GL Impact from item receipt 2.

GL Impact of FIFO item fulfillment:
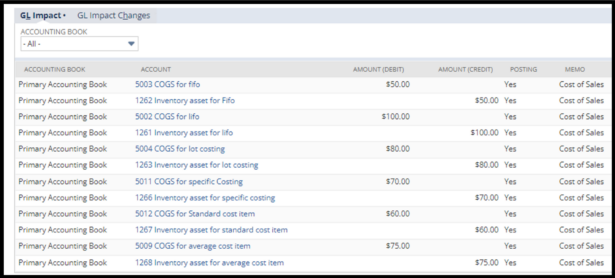
Check the inventory value of the items on the balance sheet:
Contact us today to learn more.

 RSMUS.com