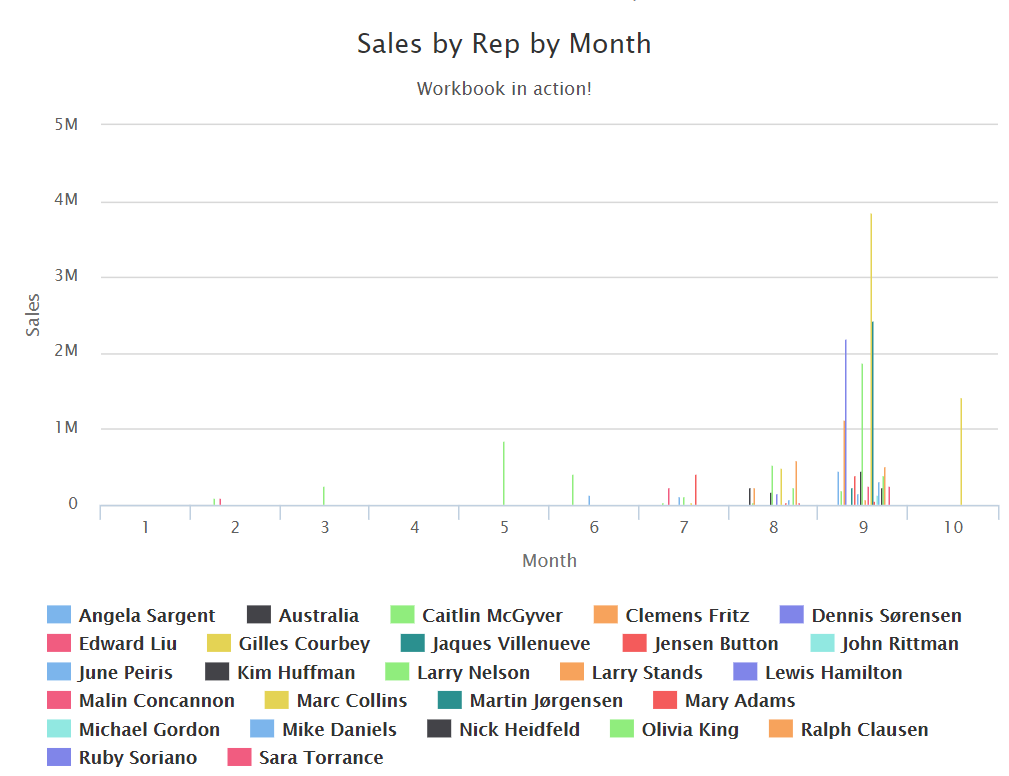
If you’ve been hanging around SuiteWorld, the annual NetSuite user conference, within the last five years then you’ve heard about the work NetSuite has been doing to improve the internal reporting offerings of the solution. It’s time to get excited because with 2018.2 we’re getting our first taste of this new functionality, called Workbooks.
Before we raise expectations too high, keep in mind, this feature is in Beta for now and there are a few things that will be refined along the way. This may include:
- Limited graphing/charting
- Drill down functionality
- Record hierarchy
What new features does it currently support?
- Drag and drop pivot and chart creation
- Data formatting
- Data export
- Workbook sharing
What’s great?
- The interface is a big improvement from the saved search and report interface
- The ability to update your criteria and immediately refresh your pivot or chart is fun to work with
- The ability to have multiple pivots or charts showing the same data a few ways adds a lot of flexibility
- The current version does a passable job of combining saved search and report strengths
What’s not?
- The field availability seems incomplete. I couldn’t add class or subsidiary criteria to my transaction workbook which seems like a big hole
- The chart feature is fun to work with but needs more formatting options for the data
- You can’t add your workbook creations to dashboards yet

So how useful is this new feature? It’s a step in the right direction and I think a few more releases will be enough to make this a full replacement and upgrade for saved searches and reports.
For more information on this topic or others related to NetSuite, contact RSM at netsuite@rsmus.com or by phone at 855.437.7202.
By: Josh Ferguson

 RSMUS.com