
 RSMUS.com
The Power Automate visual in Power BI is one of the more exciting preview features in the tool. Upon its release, Power BI Developers and End-Users can now analyze data and drive action from the click of a button. If you are familiar with Power Automate already, you are aware of all the possibilities the platform offers. You can now incorporate the Power Automate functionality directly into your Power BI reports. The Power Automate Visual can be obtained from the AppSource repository and then placed on any page in your report. Below we have outlined steps to surface the visual, develop specific Power Automate actions, and utilize the visual in a report.
Teams Message
- Open the Power BI .pbix file.
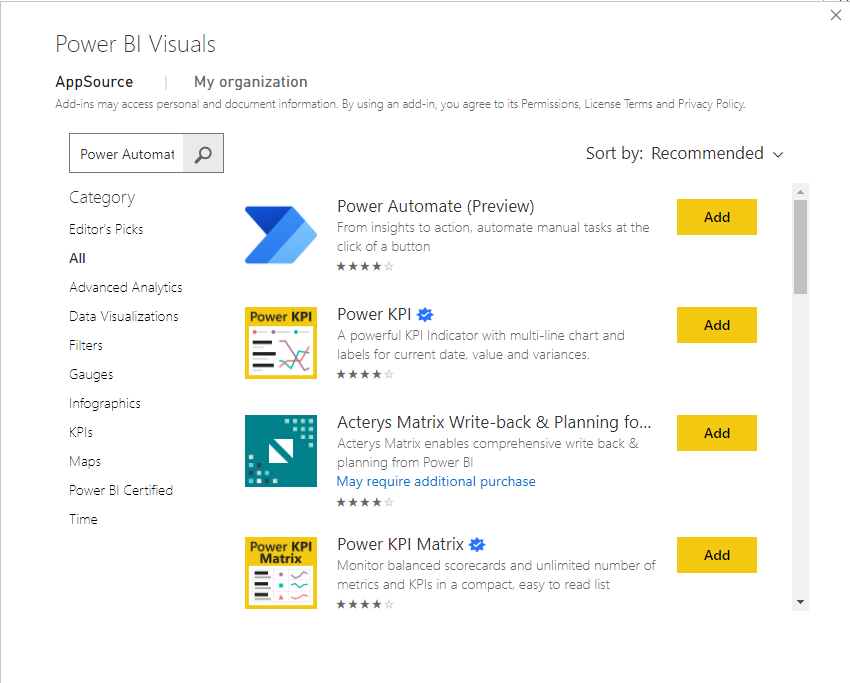
- Make sure Power Automate (Preview) visualization is downloaded from AppSource:
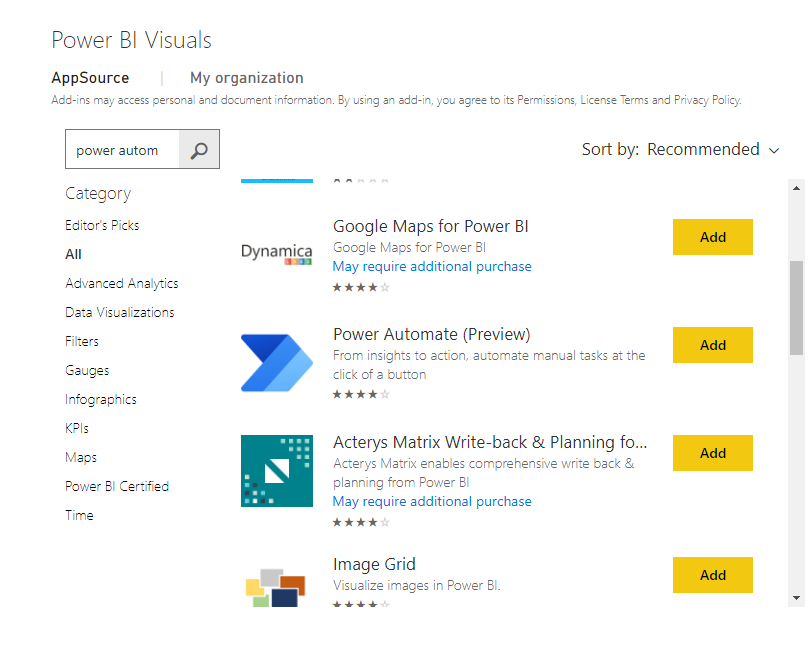
- Select the Power Automate Visual & Add Fields
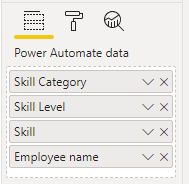
By adding fields to add to Power Automate data section of the visualizations pane, one can use those selected fields when you pass data through, in this case, to send a Teams message or update. These fields can be used at flow design time as well to specify how you want to use the Power BI Data.
The source data used in this example below is from a skills database that displays employees and various attributes such as skills, certificates they’ve earned, skill category, line of work, etc.
In this specific use case, we’d like to pass the skill category, skill level, skill, and employee name through the flow, so we will select and drag those from the Fields pane into the Power Automate data section.
- Configure Flow: Send Teams Message on Manual Trigger
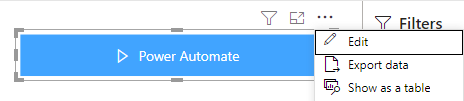
To configure your Power Automate flow, click on the ellipses and select Edit.
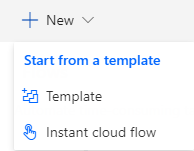
You will then be brought into the Power Automate Interface. From here, create a new flow by selecting “+ NEW” in the top left corner of the page. You can either use a template to help you get started or manually create a cloud flow. Since sending a Teams Message is an available template, go ahead and select Template then select the Send a Teams message from Power BI template.
NOTE: Make sure you are signed into the correct Microsoft account so that the flow is connected to both the correct teams and Power BI account, then click continue at the bottom of the screen
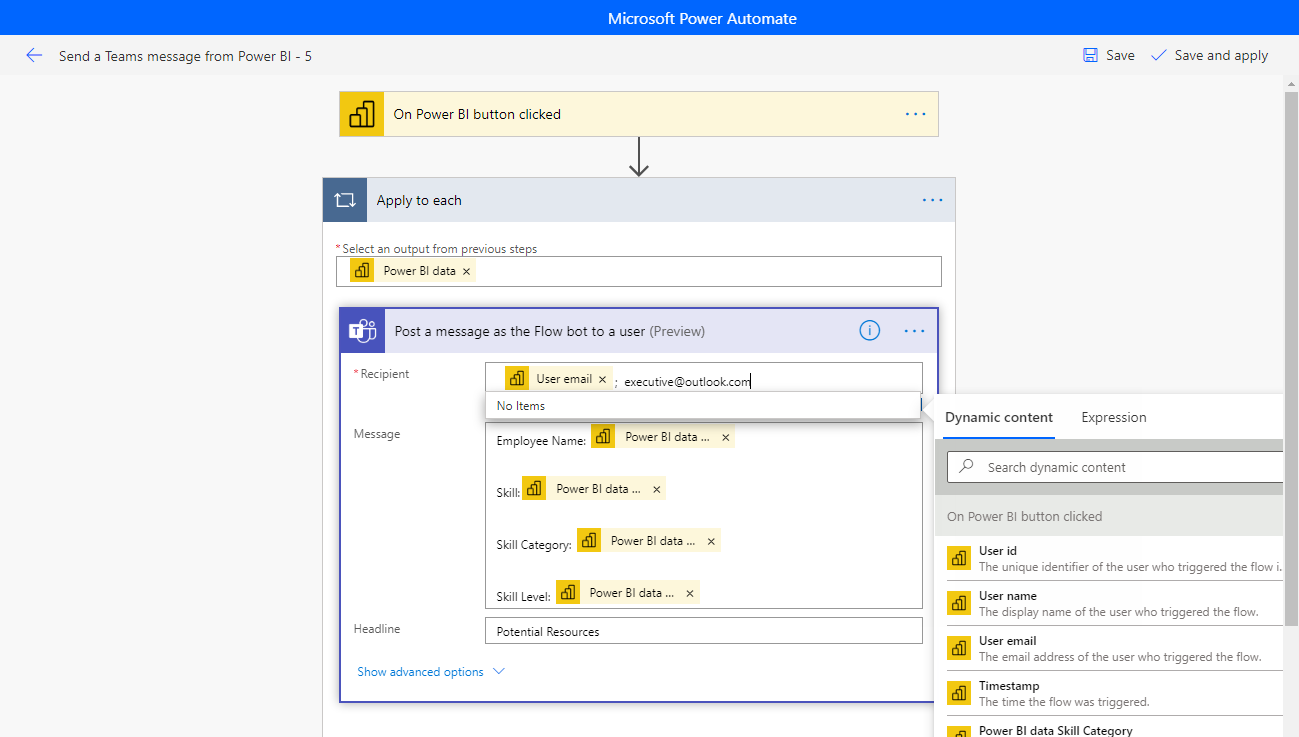
For this Teams message, let’s say you are a resource manager and are looking for employees that are well-versed in financial analysis. You’d like to send detailed message of each employee that has a skill category of either “Spreadsheet” or “Financial Analysis”. For each of these, you’d like to see the name, skill, skill level, and category of the particular employee. Because you selected these fields, you can pass them through in the message as dynamic content like in the configuration below.
To specify a recipient for the message, you have the ability to select the email of the user who used the flow in addition to any other Teams account associated email that you’d like to send the message to.
See the configured flow:
Apply to each loop: Notice that once you use a field from the Power BI dataset (Skills DB in this case), it will apply an apply to each loop. The apply to each loop is automatically included to pass the dynamic content fields through an array. These fields you pass through from Power BI to the flow will always come in an array.
Once you are done with adding the data you need to the flow, make sure to save the flow then select the back arrow at the top left of the page. From there, you may apply the query then return to the report to run the flow.
- Running the flow
Before running the flow to send the Teams messages, we want to first use the report to filter down our criteria.
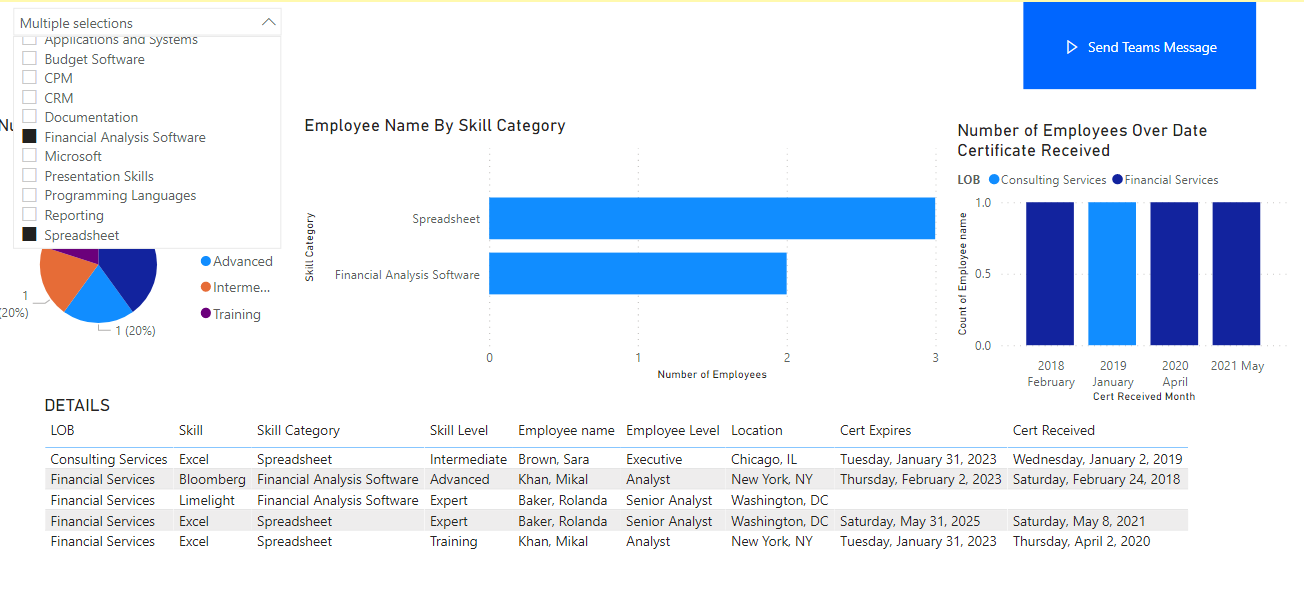
Now that we have selected the criteria, we can now run the flow to send the message based on that criteria.
To run the flow, hold Ctrl and click on the Power Automate Visual (Send Teams Message).

After triggering, your message will send in the format specified in configuration based on the filtered Power BI report.
Licensing needed
- User running the flow must have permissions to run the flow. These permissions can be granted through direct sharing by the user or by sharing to an Azure Active Directory group.
- Also to note, the Power BI visual only functions with flows in a tenant’s default environment. Any flow created with the visual is created in the users default environment
- Flows should be used directly within the report – do not go directly to Power automate to create these flows as the trigger may not have access to the fields necessary
Export Power BI to CSV. flow
Open the Power BI .pbix file.
- Make sure Power Automate (Preview) visualization is downloaded from App Source
- Select the Power Automate Visual and Add Fields
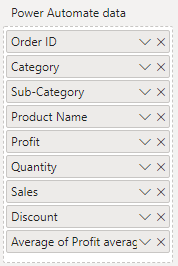
By doing this, you can select specific fields and measures that will be exported into a .CSV file. By choosing these fields, you can create data that is clean and specific to you and the needs of your organization.
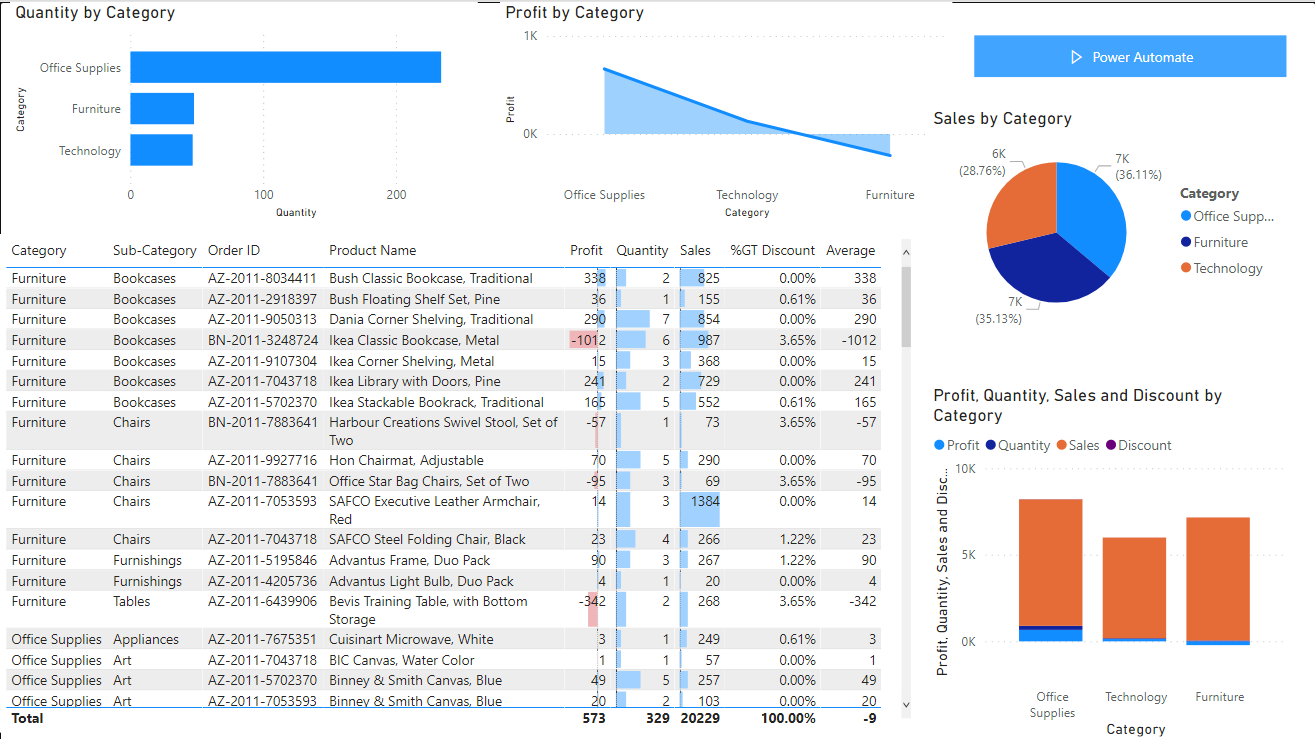
The source data in this example is data is sample data that has Order ID, Category, Sub-Category, Product Name, Profit, Quantity, Sales, and Discounts.
In this use case, we will be using all the fields and measures to be converted into a .CSV file.
- Configure Flow: Export .pbix to .csv and Upload to SharePoint
To configure your flow, click on the ellipses and select Edit:
You will be directed to the Power Automate Interface within Power BI. From there you will, create a new flow by selecting “+ NEW” in the top left corner. You will be presented with the option of creating a flow using a template or creating an instant cloud flow, for this example we will use the latter.
NOTE: Make sure you are signed into the correct Microsoft account so that the flow is connected to both the correct SharePoint and Power BI account, then click continue at the bottom of the screen
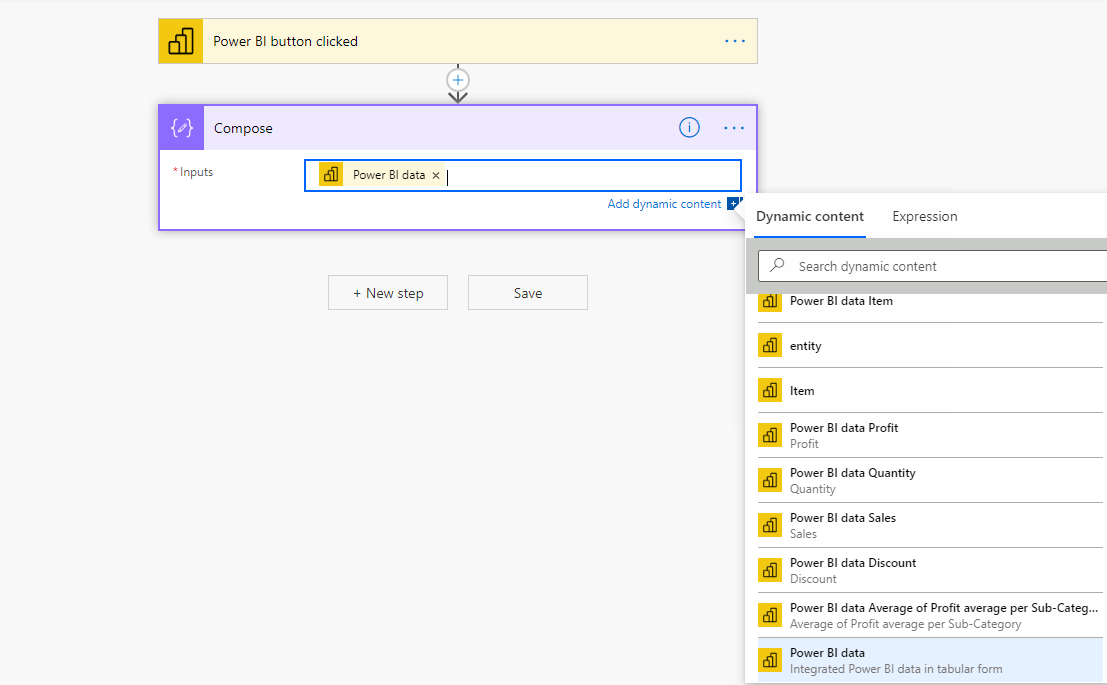
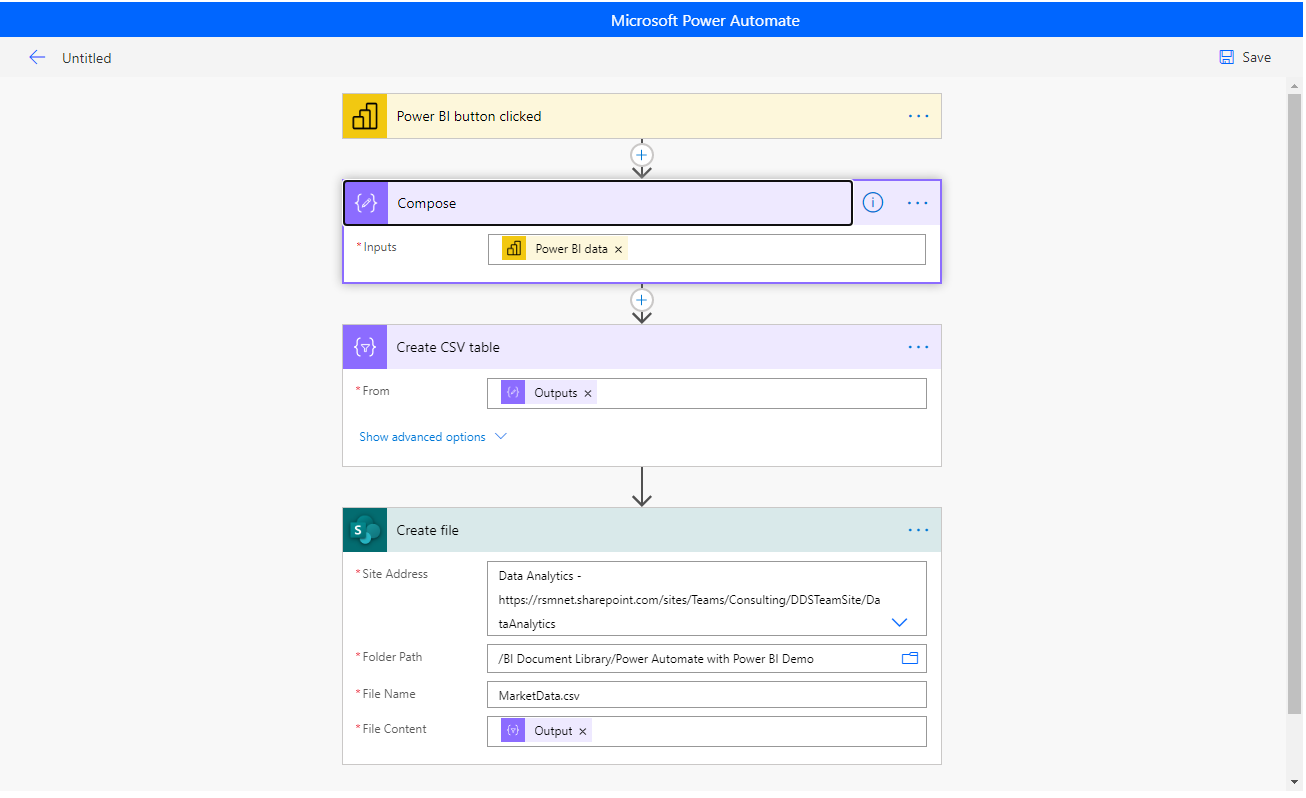
- First Data Operation in our flow will be Compose:
- We want our Inputs to be dynamic, i.e. they change as the data is updated, so we will choose Power BI data as our input.

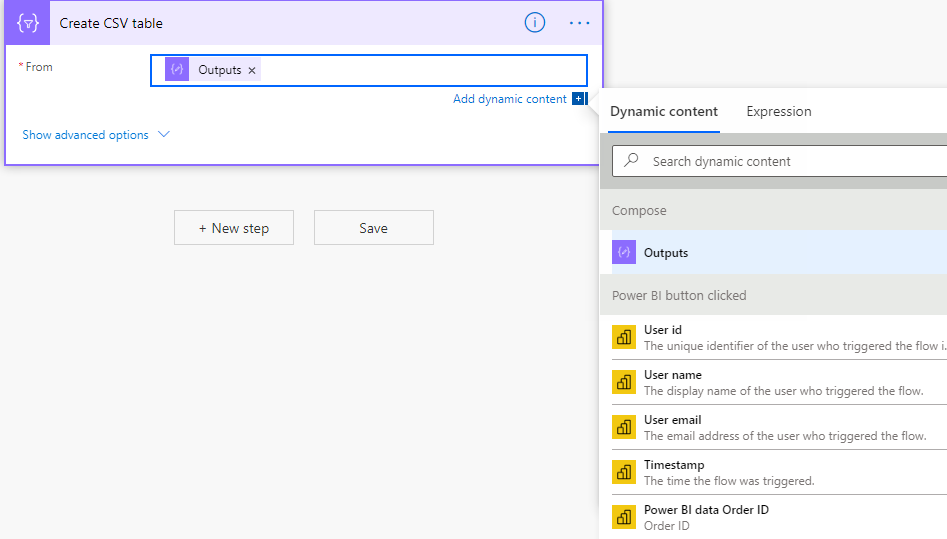
- Second Data Operation in our flow will be Create CSV table:
-
- Our CSV table will be created from our Outputs from out Power BI data, which have to stay dynamic as well.
-
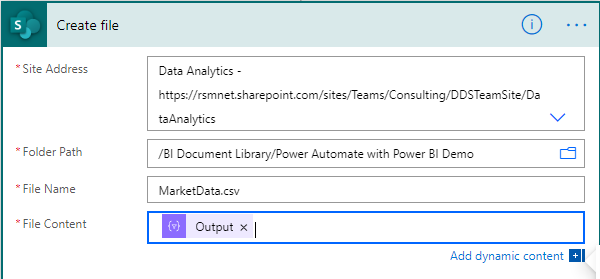
- Create a file on SharePoint
- Our last step in this flow is to export the file onto SharePoint for your organization to view.
Choose the specific Site Address and Folder Path. Make sure put the correct extension next the file name, in this example it will be .csv. Lastly, our file content will be the Output we get from the Power BI data.
- Our last step in this flow is to export the file onto SharePoint for your organization to view.
- Make sure to save your flow
- Go back to your flows home page and click apply
- Go back to report to Run report
- Running your report
- Before you run your report, format the button to your specifications.
- To run the flow, hold Ctrl and click on the Power Automate visual

-
- To view your exported .CSV – go to the SharePoint directed the file to in your flow, and you will be able to access the .CSV there.
The automation flows above are just some of the options available to developers. Developers and end-users should be encouraged to test and explore their options within the Power Automate visual within their Power BI reports. It is important to remember that this feature is powerful but is still a preview feature and not generally available. Have fun building and exploring!
By: Hishmah Hamid, Evan Hopper, Jacob Petraitis