The goal of Project Cost Operations is to monitor and control cost with real-time cost tracking features. Throughout this article, I will be taking an in-depth look of the different views and metrics that are used to help assist businesses. Project Cost Operations offer a variety of views that allow the business to keep track of specific costs, making sure they keep their labor, effort, and costs under budget, allowing for the business keep to more cash around for external expenses.
Views
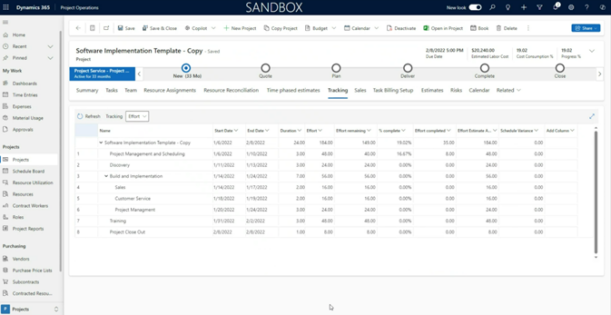
Effort Tracking View
The Effort Tracking View tracks the progress of a schedule. It compares the actual effort hours spent to the planned effort hours. There are four main metrics used in the Effort Tracking View: Progress Percentage, Estimate to Complete, Estimate at Complete, and Projected Effort Variance. This view is special because it shows progress bars and color coding to allow the user to know what tasks are on track, at risk off not being completed, and over/under budget. The way to view this view is Project Operations > Projects Pane > Tracking.

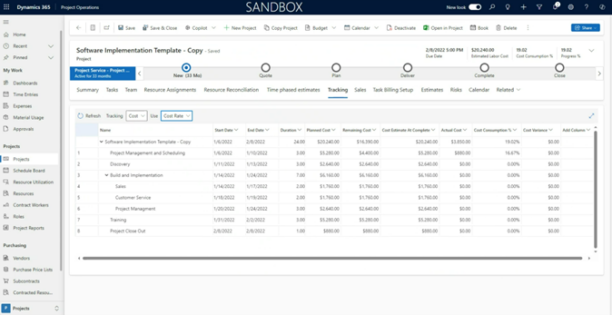
Cost Tracking View
The Cost Tracking View compares the estimated cost to the actual cost that was spent per task. The four metrics used are: Percentage of Cost Consumed, Cost to Complete, Estimated Cost at Complete, Projected Cost Variance. The way to view this view is Project Operations > Projects Pane > Tracking > Cost.

Summary
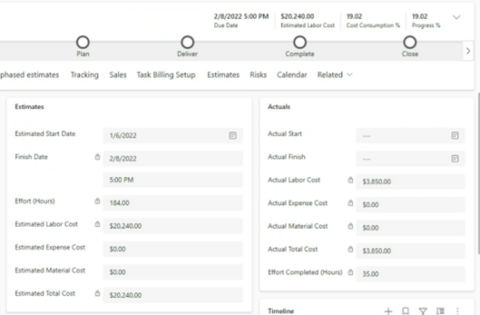
Overall, the home page allows for the user of Dynamics 365 to compare the Actual versus Estimate cost. In the graphic below, the user can view all estimates the user/company forecasted versus the actual cost to compare the costs. This is important for businesses due to the fact they do not want to spend more than they estimated for the period. Also, you can view the Progress % and Cost Consumption % explaining the percent complete.

Metrics
Through the three views, there are various metrics used to ensure the ability to monitor and control project costs in real-time.
- Planned Cost
- Estimated Cost of all resource assignments on each leaf node task
- Actual Cost
- Sum of all costs actuals for time recorded on the task
- Cost Consumption Percentage
- Actual cost / Cost estimate at complete
- Remaining Cost
- Cost estimate at complete – actual cost
- Cost at Complete
- Remaining cost + Actual Cost
- Cost Variance
- Planned cost – Cost estimate at complete
- Progress Percentage
- Actual effort spend to date / Estimate at complete (EAC)
- Estimate to Complete
- Estimate at complete – Actual Effort spent to date
- Estimate at Complete
- Remaining effort + Actual effort spent to date
- Project Effort Variance
- Planned effort – EAC
- Percentage of Cost Consumed
- Actual cost spent to date / Estimated cost at complete for the task
- Cost to Complete
- Estimated cost at complete – Actual cost spent to date
- Estimated Cost at Complete
- Cost to Complete + Actual cost spent to date
- Project Cost Variance
- Planned cost – Estimated cost at complete

 RSMUS.com


