Most Microsoft Dynamics GP users love SmartLists and those that have deployed them, love Excel Refreshable (ER) Reports. ER Reports give users access to Dynamics GP data in real time and refresh in a fraction of the time it takes to run SmartLists, and export the results to Excel. While you can create an ER report from any SmartList, in Excel you don’t get the SmartList interface which lets you create custom filters and limit the results to only the records you want to work with. Sure, you can filter the data once you get it to Excel, but if you’re working with large data sets or want to make things as easy as possible for the users of the report, you need a better way. Follow these steps to create a hybrid report in Excel that combines the flexibility of a SmartList with the speed of an ER report.
1. Assuming you’ve deployed Excel Refreshable Reports, start by opening a report that has the data you want.
2. Select the Data tab and select Connections from the Connections group.
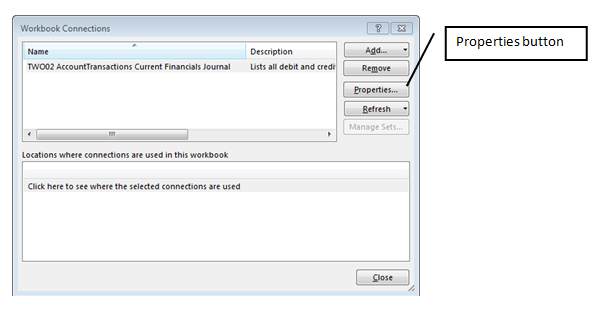
3. In the Workbook Connections window, select the connection listed and click the Properties button.
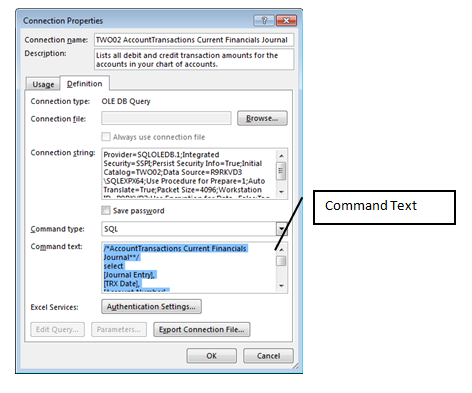
4. In the Connection Properties window, select the Definition tab and copy the contents of the Command Text window.
5. Open a new tab in the workbook or, if you’d like, a new workbook.
6. Go back to the Data tab. In the Get External Data group, select From Other Sources and From Microsoft Query from the list of sources.
The problem with the standard connections in the Excel reports is that they don’t support parameters. You’ll notice in the above screenshot that the Parameters… button is disabled. Connections created with Microsoft Query do support parameters. That’s why we need to create a new connection.
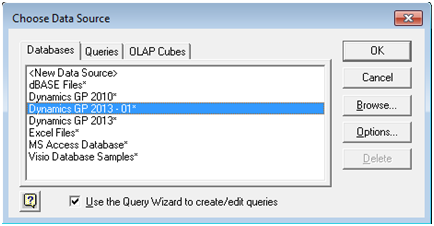
7. In the Choose Data Source window, select your Dynamics GP data source. It should be the same as the Server Name that appears when you login to Dynamics GP.
8. Login to the SQL server. You can’t use your GP login. You’ll need a SQL account or a domain account with the necessary access.
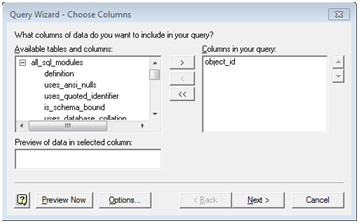
9. The Query Wizard window will open. Here’s where you need a little faith. From the list of tables you’re presented with, select any table and any column. We will be replacing this later with the data you actually want. In the example below, I’ve expanded a table and inserted the first column in it into the columns list.
10. Click Next until the Query Wizard – Finish window opens. Click Finish.
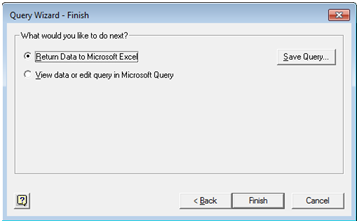
11. In the Import Data window, choose where you want the data to be returned.
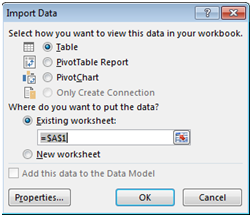
12. Now that you’ve created a data connection, you need to edit it to get the data you want and add the parameters.
13. Go back to the Data tab again. Select Connections from the Connections group.
14. You should now see your new connection in the Connections list. Select it and click the Properties button.
15. Select the Definitions tab and replace the contents of the Command Text window with the text you copied earlier.
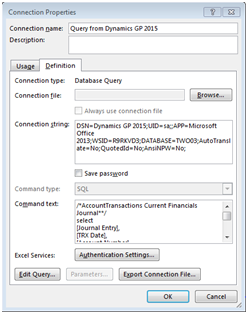
16. Click OK and your new worksheet should populate.
Now add the parameters.
17. Go back to the Data tab. Select Connections from the Connections group.
18. Select your connection and click the Properties button.
19. Select the Definition tab.
20. In the Command Text window, add the fields you want the user to be prompted for to the query’s Where clause. In my example, I’m using the Account Transactions SmartList and I want the user to be able to enter the Transaction Date and the Source Document.
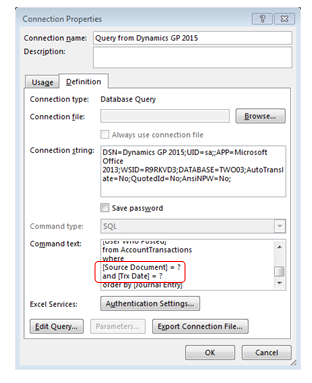
Be sure to enter the field names correctly, separate multiple fields with “and” or “or” and to set each field equal to “?”. The question mark tells Excel that you want the user to be prompted for the information each time the query is executed.
You’ll notice that in the screenshot, the Parameters… button is still disabled.
21. Click OK to save the new definition. You’ll be prompted to reconnect to the SQL server and then you’ll be prompted to supply the parameter values.
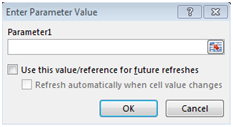
22. The data should refresh and be filtered based on the parameters and values you supplied.
23. The final step is to provide names for the parameters. Go back to the Data tab one more time.
24. Select Connections from the Connections group.
25. Select your connection and click the Properties button.
26. Select the Definition tab.
27. The Parameters… button should now be enabled. Click it to open the Parameters window.
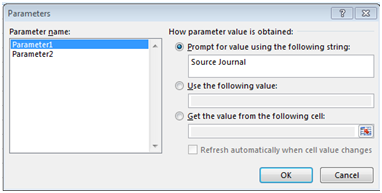
28. Enter a prompt for each parameter and, optionally, select a cell where the user can enter the parameter value. Using cells for the parameters lets the user enter all the values in a single location and see the data change dynamically without having to use the refresh button.
The more you know about SQL queries and SQL security, the easier it is to complete these steps successfully. Once you’ve mastered it you’re well on your way to delivering some really powerful and useful reports and dashboards.
Accessing the data in your system is extremely important and sometimes its tricky how to decide the best tool. Please leave additional tips or comments about how useful you found this blog. If you still have other reporting questions in Dynamics GP, our Microsoft Dynamics Support Specialist can help. We offer access to certified professionals, help desk and phone support, and additional opportunities for on-going education. Contact our professional at erp@rsmus.com or by phone at 855.437.7202 to learn more.
[Tweet this post] if you like this tip!
By: Hans Wulczyn – Pennsylvania Microsoft Dynamics GP partner

 RSMUS.com