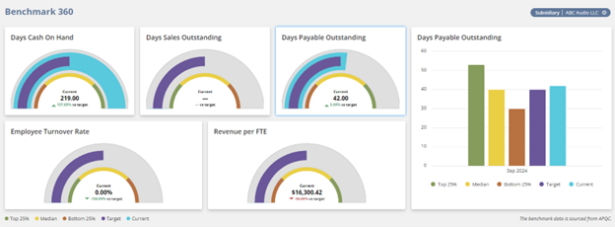
In today’s competitive business landscape, understanding key performance indicators (KPIs) is essential for maintaining a strong financial position. When clients refer to metrics like Days Sales Outstanding (DSO) or Days Payable Outstanding (DPO), many businesses rush to generate reports or saved searches. Fortunately, NetSuite offers a powerful built-in solution: the Benchmark 360 SuiteApp.
Key features of Benchmark 360
The Benchmark 360 SuiteApp provides invaluable insights into your company’s performance using a range of KPIs sourced from the American Productivity and Quality Center (APQC). Its key features include:
- Comprehensive KPI Dashboard: Track essential metrics like Days Cash on Hand, DSO, DPO, Employee Turnover Rate, and Revenue per FTE.
- Industry Benchmarking: Compare your company’s performance against industry standards to identify where you stand relative to your peers.
- Customizable Metrics: Set adjustable targets for each KPI to align with your specific business goals.
- Subsidiary Mapping: Access benchmark data tailored to each subsidiary, based on its industry and region.
- Best Practice Guides: Utilize NetSuite content and articles to implement effective business strategies.
Installing the Benchmark 360 SuiteApp
To get started with Benchmark 360, follow these installation steps:
- Navigate to SuiteApps in NetSuite.
- Enter Benchmark 360 in the search field.
- Click on the SuiteApp tile, then select Install.
- Confirm the installation by clicking OK.
Prerequisite: Ensure you have a NetSuite OneWorld account.
Setting Benchmark 360 preferences:

Once installed, you can customize the dashboard to display relevant benchmark data. Follow these steps:
- Navigate to Lists > Benchmark 360 > Benchmark 360 and click Preferences.
- Under Account Preferences, set values for:
- Industry: Select your business type.
- Region: Choose your operational area.
- Company Size: (Optional) Indicate your company’s size.
- In the Classification section, verify the KPIs:
- Preselected KPIs include Days Cash on Hand, DSO, DPO, Employee Turnover Rate, and Revenue per FTE.
- Enter target values for each KPI. If left blank, the system will use the median benchmark from APQC.
Understanding Key Metrics

Days Cash on Hand (DCOH): This metric estimates how many days your company can cover its operating expenses. A higher DCOH indicates lower financial risk.
Formula:
DCOH = (Bank Balance + Other Current Assets) / (Operating Expense / Number of Days)
Days Sales Outstanding (DSO): Reflects the average number of days it takes for customers to pay their invoices. A lower DSO indicates better cash flow.
Formula:
DSO = Average days open of fully paid invoices for the month
| Invoice | Transaction Date | Date Closed | Number of Days Open |
| Invoice A | April 25, 2024 | May 31, 2024 | 36 |
| Invoice B | May 1, 2024 | May 31, 2024 | 30 |
| Invoice C | May 13, 2024 | May 31, 2024 | 18 |
Days Sales Outstanding (SDO) = (36 + 30 + 18)/3 = 28
Days Payable Outstanding (DPO): This measures how long it takes your company to pay its bills, with a lower DPO indicating better cash management.
Formula: Days Sales Outstanding (DSO) = Average days open of fully paid invoices for the month. For example, Company B has three invoices closed on May 31st with the following details:
| Invoice | Transaction Date | Date Closed | Number of Days Open |
| Invoice A | April 25, 2024 | May 31, 2024 | 36 |
| Invoice B | May 1, 2024 | May 31, 2024 | 30 |
| Invoice C | May 13, 2024 | May 31, 2024 | 18 |
| Days Sales Outstanding (DSO) | = | (36 + 30 + 18)/ 3 |
| = | 28 |
Revenue per Full-Time Equivalent (FTE): This HR metric indicates the revenue generated per employee.
Formula:
Revenue per FTE = Revenue / Average Number of Active Employees
For example, if Company A’s revenue in 2023 is $3,500,000 and the total number of FTEs for the year is 150, the annual revenue per FTE is calculated as:
| Revenue per FTE | = | $3,500,000/ 150 |
| = | $23,333 |
Employee Turnover Rate: This metric indicates the percentage of employees who leave your company within a given month. A lower turnover rate often reflects higher employee satisfaction.
Formula:
Employee Turnover Rate = (Number of Employees Leaving During the Month / Average Number of Active Employees for the Month) × 100
For example, on May 1st, Department A has 50 employees. During the month, 2 senior employees retired, and 3 others resigned. By the end of May, Department A has 45 employees. The employee turnover rate is calculated as:
| Employee Turnover Rate | = | (5/45) 100 |
| = | (0.11) 100 means 11.11% |
Limitations of Benchmark 360
While the Benchmark 360 SuiteApp offers many benefits, it does have some limitations:
- Fixed KPIs: The KPIs included in the dashboard are fixed and cannot be customized.
- Currency Conversion: Currency conversion is unavailable for currencies without an exchange rate in NetSuite, resulting in a USD display for unsupported currencies.
Conclusion:
The NetSuite Benchmark 360 SuiteApp is a powerful tool that enables businesses to compare and improve their key performance metrics. By leveraging this SuiteApp, you gain a deeper understanding of your performance relative to industry standards, enhancing your operational effectiveness. In today’s competitive business landscape, NetSuite’s Benchmark 360 SuiteApp offers a comprehensive solution to track key performance indicators (KPIs) such as Days Sales Outstanding (DSO) and Days Payable Outstanding (DPO), providing invaluable insights to elevate your business. Learn more about unlocking efficiencies with NetSuite ERP.
Ready to elevate your business insights? Explore the Benchmark 360 SuiteApp today or contact the RSM NetSuite team for more information!

 RSMUS.com


