Profiling your data upon loading it into Power BI is key to building accurate, quality reports. Power Query examines data from an existing source and provides information about it including the uniqueness of rows, column emptiness, errors, data types, and more.
Best practices when profiling data in Power Query
The first thing you will need to do after loading your data into Power BI is open Power Query, you can do this by clicking the “Transform Data” button under Home in the top ribbon. Once in Power Query, you will need to click “View” in the top ribbon and check the following features:

Second, you will need to select “Column profiling based on entire data set” in the bottom left corner of your screen in order to see statistics for all of your data.
Note: If you have a large dataset, you may not be able to profile your whole table in Power Query and the profiling tools may time out if this is the case.

Profile your data
Now, you may properly profile your data! Using both column distribution and column quality features, you will be able to see the following underneath your column headers:
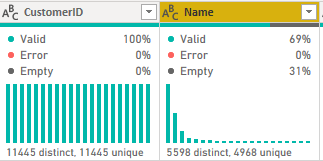
These features can help ensure that any columns you expect to be unique, such as a primary key, have 100% valid, unique values. In the table shown above, CustomerID is a primary key. You can see by the green bar underneath the header and by the column profile (Valid, Error, and Empty) that the column is completely full.
You can ensure the values are unique via the column distribution bar chart and the text underneath. In a primary key, the number of distinct and unique values should be the same, and the column should have 0 errors and 0 empty rows.
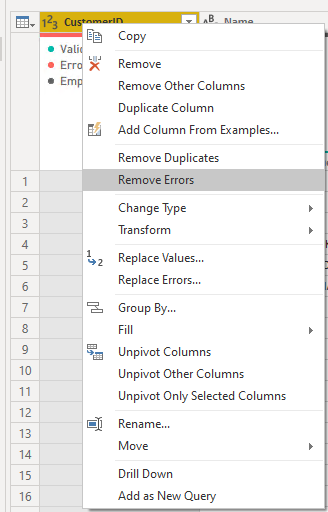
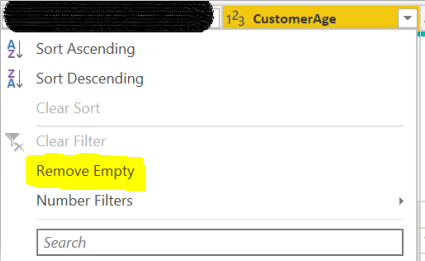
Errors may arise if the data loaded does not match the data type Power BI expects from the column. In this case, you can right-click on the column header and change the data type if appropriate. If errors can be removed from your data, you may do so by right-clicking the column header and selecting “Remove Errors”. This menu also allows for a plethora of data cleansing actions including removing duplicates, replacing values/errors, and performing data transformations. If you click on the dropdown menu on column headers, you are also able to remove empty rows. These actions can be seen below.
Column profile
If you want to dig into more details of your data, you can utilize the “column profile” feature. This feature shows column statistics such as the number of records, non-number rows, minimum value, maximum value, average, and a more detailed distribution of the column’s contents. You just need to select the column you’d like to profile and the information shown below will appear.
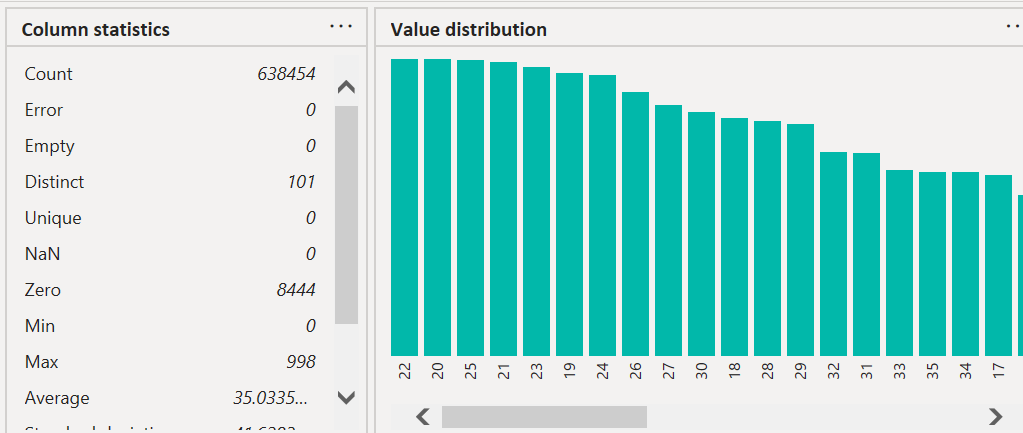
Column profiling is a great way to stake out any outliers or misleading data. For instance, the column I have profiled above is ‘CustomerAge’. You can see that the max value in this column is 998 (manual entry error) and the minimum value is 0 (for customers who did not enter an age). If you don’t want these numbers skewing your data, there are a few options in dealing with them.
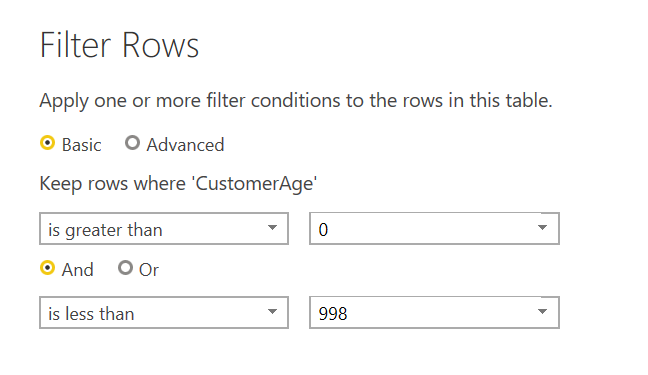
You can set a number filter on this column to only show data for ages greater than, less than, or between parameters that you set. This can be done by selecting the drop-down menu in the column header, selecting ‘Number filter’, and then choosing whichever parameter is appropriate for your data.
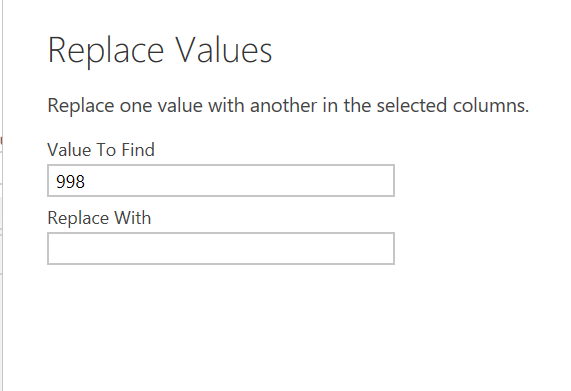
If you don’t want to get rid of the related data in other columns where ages are 0 or 998, but you also don’t want the values skew the average for age, you can use the “Replace Values” option which will let you find and replace the outliers with whatever value you want in their place (null, N/A, etc.).
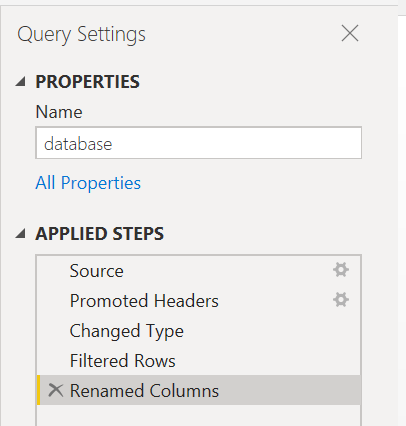
If at any point you realize you added changes that you’d like to remove, you can use the Query settings pane on the right side of your screen. This will allow you to delete steps by clicking the ‘X’ on the left. This also allows you to go back to the process and see what the data looked like at each step. Below, if you wanted to see what the data looked like before columns were renamed, you could click on the previous step of ‘Filtered rows’ to see the data at that point in the process.
Data profiling is key to understanding the complexities of your data before building reports. Using these tips can save you time and energy in the long run by isolating errors, blanks, or outliers before they become an issue.

 RSMUS.com