
 RSMUS.com
Field technicians that have to go onsite and perform repairs and/or installations, have to keep track of what they have in their truck inventory at all times. It would also be very beneficial for them to be able to see which products they need to complete their work orders, so with that in mind, I created an inventory dashboard in the mobile application for Dynamics 365 for Field Service. In this article I will show you how to configure such a dashboard. Before I started the configuration, I created a warehouse called ‘Truck 2’, and added my resource record to the truck by opening the truck warehouse and navigating to related>bookable resources.
Step 1:
The first part of the inventory dashboard will show the current inventory on the truck the field service technician is driving. Let’s open the woodford application by logging into Dynamics 365 and navigating to Settings>Woodford>MobileCRM Woodford HTML 5.
The first thing we’re going to do is create a view for the Product Inventory entity that shows all the inventory that is currently on the technician’s truck.
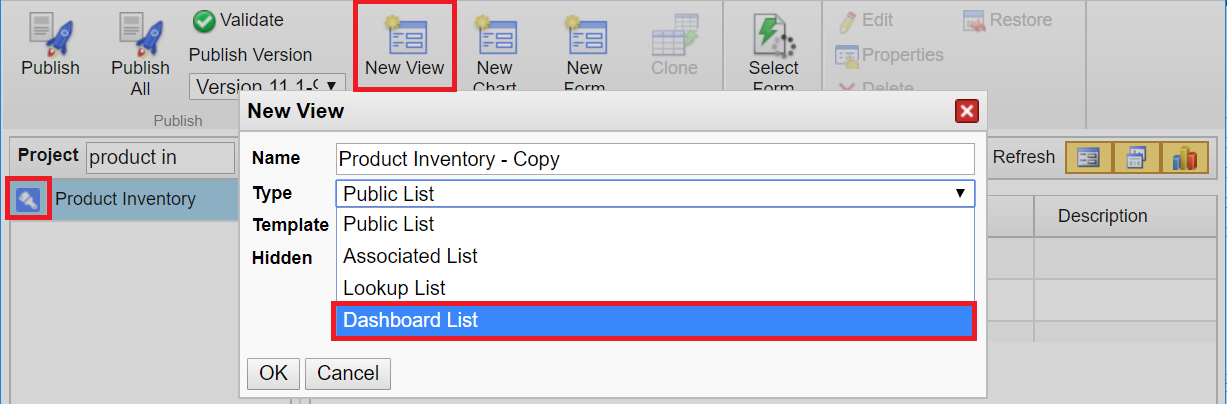
Scroll down or search for the product inventory entity in the left side of the project, then select the icon on the left side of the entity to open the configuration screen. Click the ‘New View’ button on the ribbon and change the type drop down to ‘Dashboard list.
Step 2:
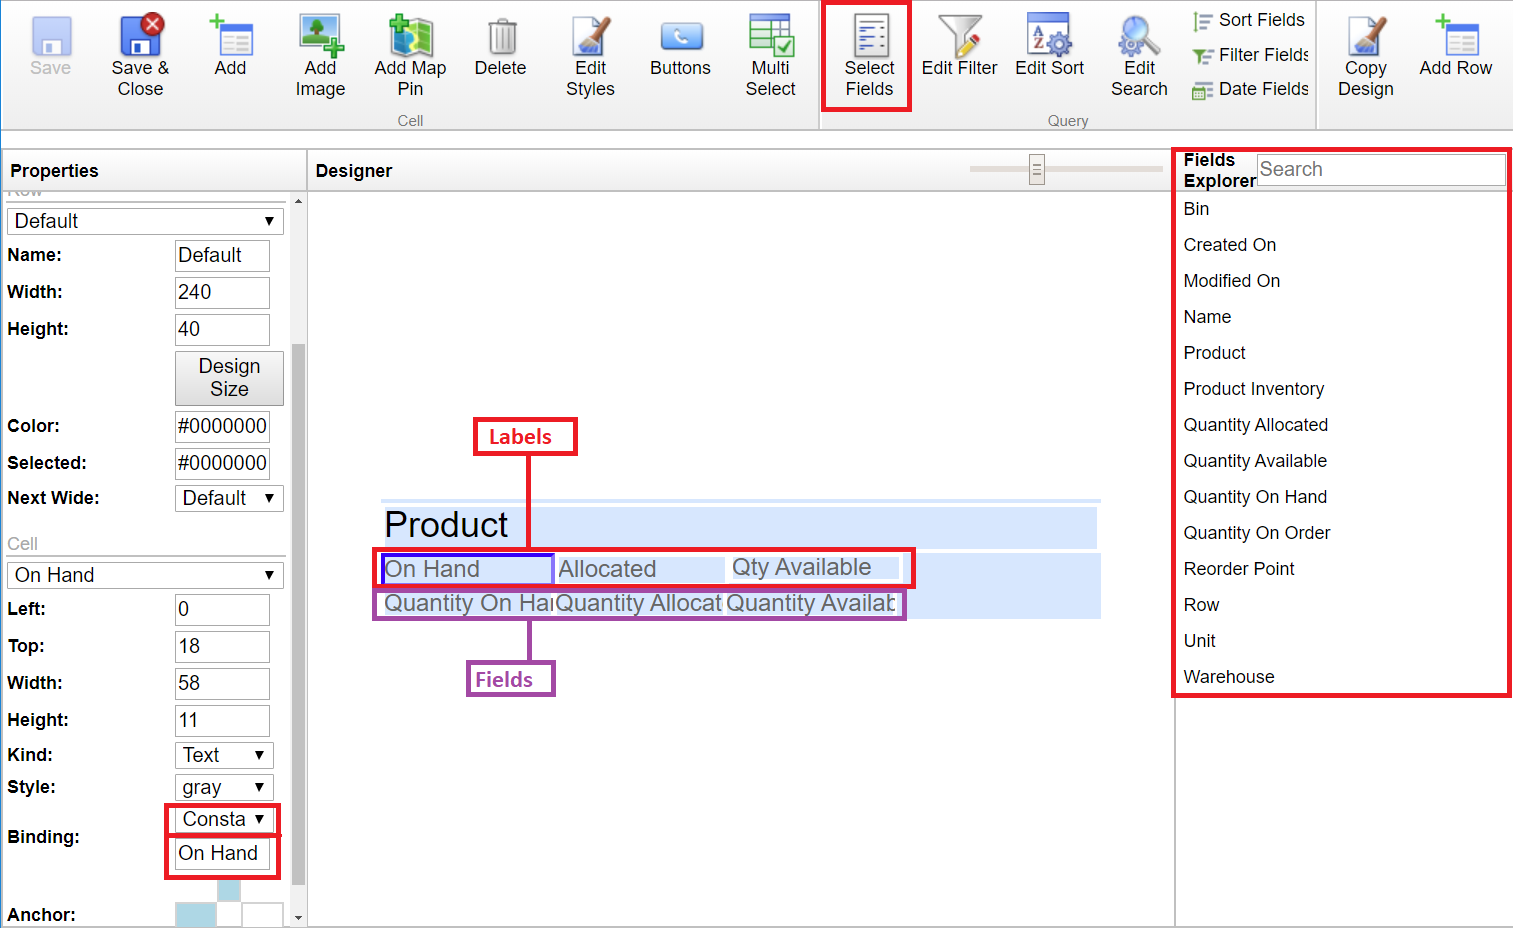
You can add fields to the fields explorer by clicking on the Select Fields button on the ribbon, and drag the fields from the field explorer to the form. The fields I added are : Product, Quantity on Hand, Quantity Allocated and Quantity Available. I also added labels above each of the quantity fields, so the technician can see which is which. You can do this by dragging another field on the form, and changing the field under ‘style’ to ‘Constant’, and enter the value in the binding field. this will allow you to hard code the field so a set value(label).
Step 3:
Once you added your fields to the view, we’re going to click on the ‘Edit Filter’ button on the ribbon to filter out the records to only show the product inventory items that are related to the truck the signed in user is related to. (I’m using the out of the box 1:N relationship between warehouse and bookable resources and the user related to that bookable resource)
Step 4:
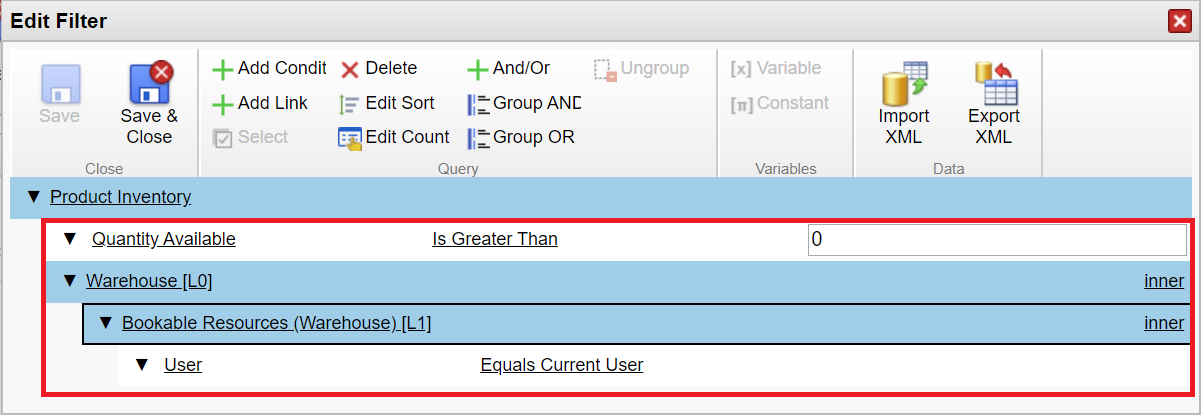
Click ‘Add Condition’ to add the Quantity Available field under Product Inventory and set it to ‘Is Greater Than 0’. Then click the ‘Add Link’ button to add the warehouse relationship, under which you want to click “Add Link’ again to add the relationship between warehouse and bookable resource. Under that, select the ‘User’ field to “Equals Current User”. The below screenshot is how your view should look. Save and close the filter editor and the view.
Step 6:
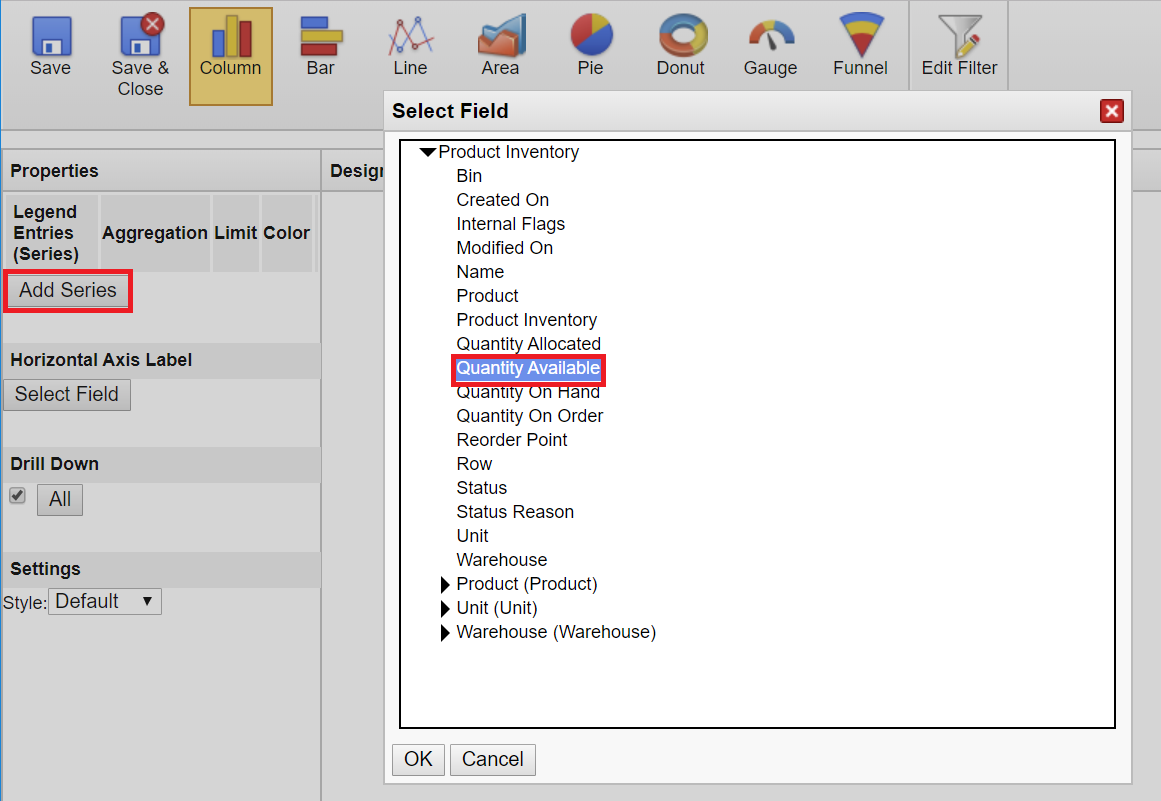
In addition to the view, let’s also create a chart to visualize the items. From within the Products Inventory entity, click ‘New Chart’ on the ribbon, name it ‘Truck Inventory’ and click ‘Ok’. Change the chart type to a column chart. Configure the filtering the same way you did for the view (Screenshot above), then click ‘Save & Close’. Click on the ‘Add Series’ Button and select the ‘Quantity Available’ field, then click ‘Ok’. When the ‘Select Field’ window closes, make sure you set the aggregation to ‘Sum’. Click on the ‘Select Field’ button under Horizontal Axis Label and select the ‘Product’ field then click ‘Save & Close’ to save the chart.
Step 7:
Now let’s setup a view that shows the technician all the work order products he/she will be needing for this coming week. In the project, open work order product and click the icon on the left side again to open the configuration window. Select ‘New View’ from the ribbon and set the type to a dashboard view, just like we did in the previously created view. Name the view. I called it ‘Products for this week’, add the ‘Products’ and ‘Estimated Quantity’ fields to the form and any other fields you want to add. (I also added the account related to the work order to the view, but you can add any field(s) you would like. Click on the ‘Edit Filter’ button on the ribbon to filter out the work order products as shown in the screenshot below:
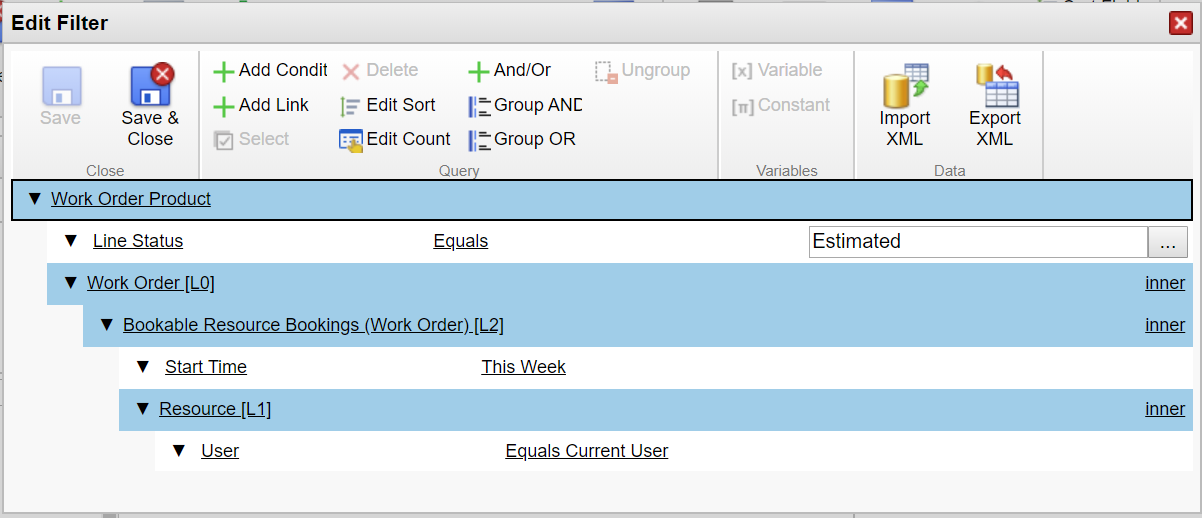
Step 8:
We are also going to create a chart for these items. From within the Work Order Products entity, click ‘New Chart’ on the ribbon, name it ‘This Week’s Parts’ and click ‘Ok’. Change the chart type to a column chart. Configure the filtering the same way you did for the view (Screenshot above), then click ‘Save & Close’. Click on the ‘Add Series’ Button and select the ‘Estimate Quantity’ field, then click ‘Ok’. When the ‘select field’ window closes, make sure you set the aggregation to ‘Sum’. Click on the ‘Select Field’ button under Horizontal Axis Label and select the ‘Product’ field then click ‘Save & Close’ to save the chart.
Now let’s create the Dashboard and add the views and charts to the dashboard!
Step 9:
Click on Dashboards and click ‘New’ on the ribbon. Name your dashboard, then click ‘OK’. (I’m going to re-create the dashboard so I’m going to call it Inventory Dashboard 2) In the designer, click on the first column in the first row (which currently reads ’empty’ and click the ‘Add View’ button on the ribbon. Select the ‘Product Inventory [msdyn_productinventory]’ entity as the template, then click ‘Ok’. Select the view you just created, and any additional views you want to be available on the dashboard. Set the view you created as the initial view, then click ‘Save & Close. Add the view for the Work Order Products [msdyn_workorderproduct]the same way in the square adjacent to the Product Inventory view.
Step 10:
Now let’s add the carts under the views: Click on the left bottom square and click the ‘Add Chart’ button on the ribbon and select the ‘Product Inventory [msdyn_productinventory]’ entity as the template, then click ‘Ok’. Select the chart you just created (and any additional charts you want to show) and set it to be the initial view. Add the chart for Work Order Products [msdyn_workorderproduct] the same way in the square adjacent to the Truck Inventory chart. Save & Close the chart and the dashboard. One last thing we need to do is to make the dashboard accessible for the field technician using the mobile application.
Step 11:
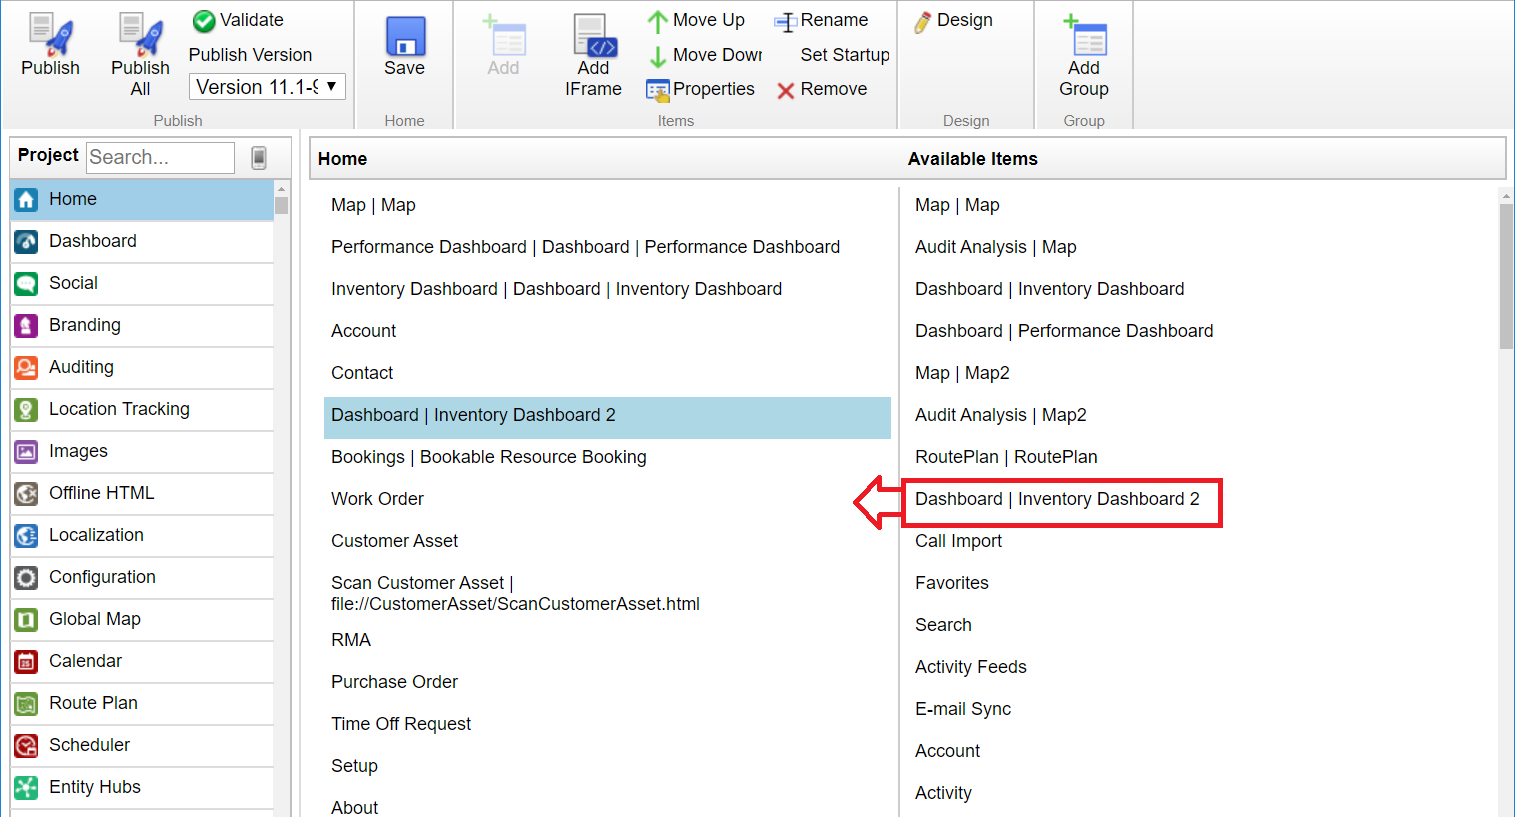
In the main project window, click on Home. Under ‘Available Items’ on the right side you should see the dashboard you just created. Drag the dashboard onto the Home section. You have the ability to change the name of the dashboard by clicking the ‘Rename’ button on the ribbon. Click the ‘Save’ button on the ribbon and publish your project.
Step 12:
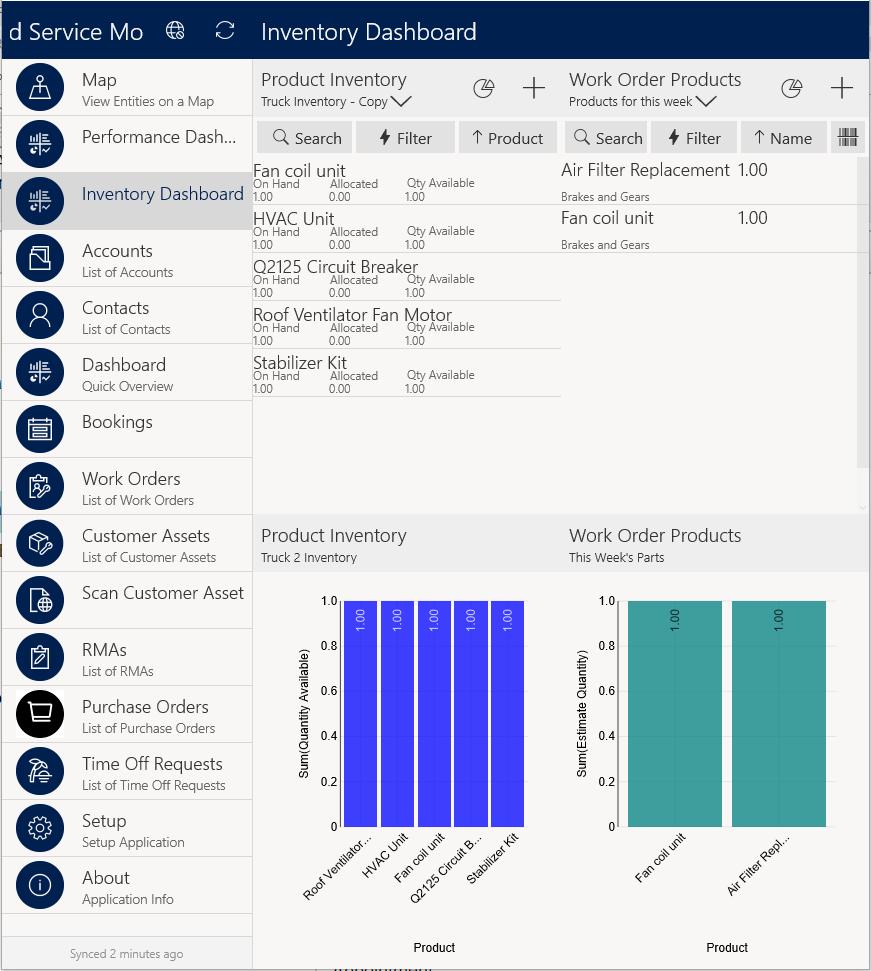
You can now open the Field Service mobile app, sync to make sure you have the most recent project including teh changes you made and test it out! (Make sure you add yourself to the truck warehouse, add some products to the truck warehouse and schedule a work order for yourself.) Below is what the dashboard should look like!
I hope you enjoyed this article! Tune in next week for another article where I will discuss how to show in which warehouse work order products are available.
This article was originally published on https://d365goddess.com/field-service-inventory-dashboard
Dian Taylor
Dian Taylor is a Microsoft Business Applications MVP and a LinkedIn Learning Author. She works at RSM as a Dynamics 365 (CRM) Presales Director. Dian is a seasoned pre-sales consultant specializing in Microsoft Dynamics 365 Customer Engagement since 2011. In the past Dian has been involved in solution designing, implementing, configuring and customizing several complex scenarios in various industry sectors. D365-CE modules: Sales, Sales Insights, Custer Service, Omnichannel for Customer Service, Field Service, Project Service Automation, Project Operations. Power Platform: Power Automate, Power Virtual Agents Website: https://d365goddess.com YouTube: https://youtube.com/d365goddess Twitter: @D365Goddess