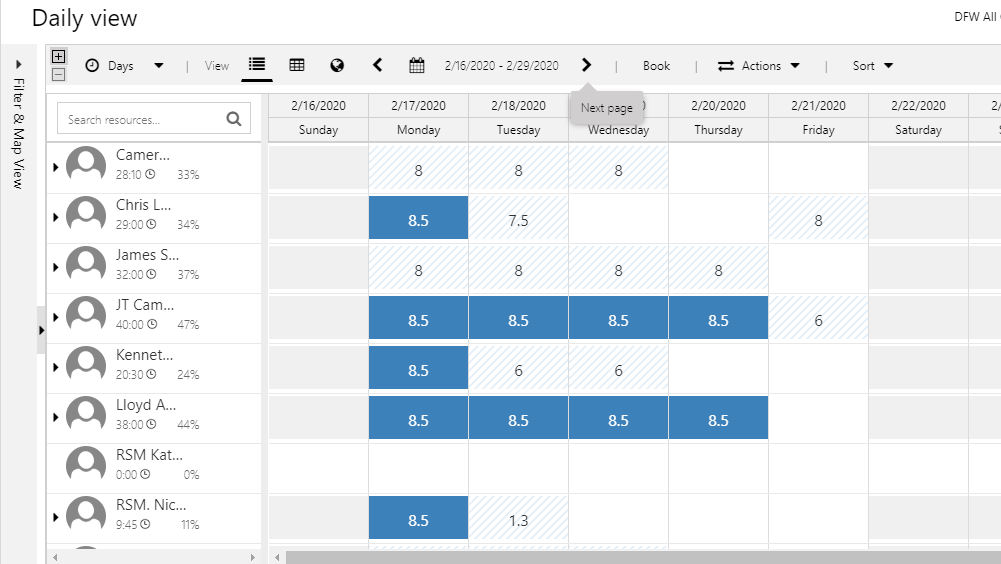
A frequent request by clients is to provide schedule board details when you go to a daily or weekly view of the schedule board. By default, when you go from an hour’s view to a daily or weekly view, you only see the hours for each resource by day as you can see below, but there are no details as to what work those resources are working on. Regarding the hour’s view of details, another frequent request is to add additional details to the bookings and we have another great post in our blog that shows you how to Add more detail to your schedule board.

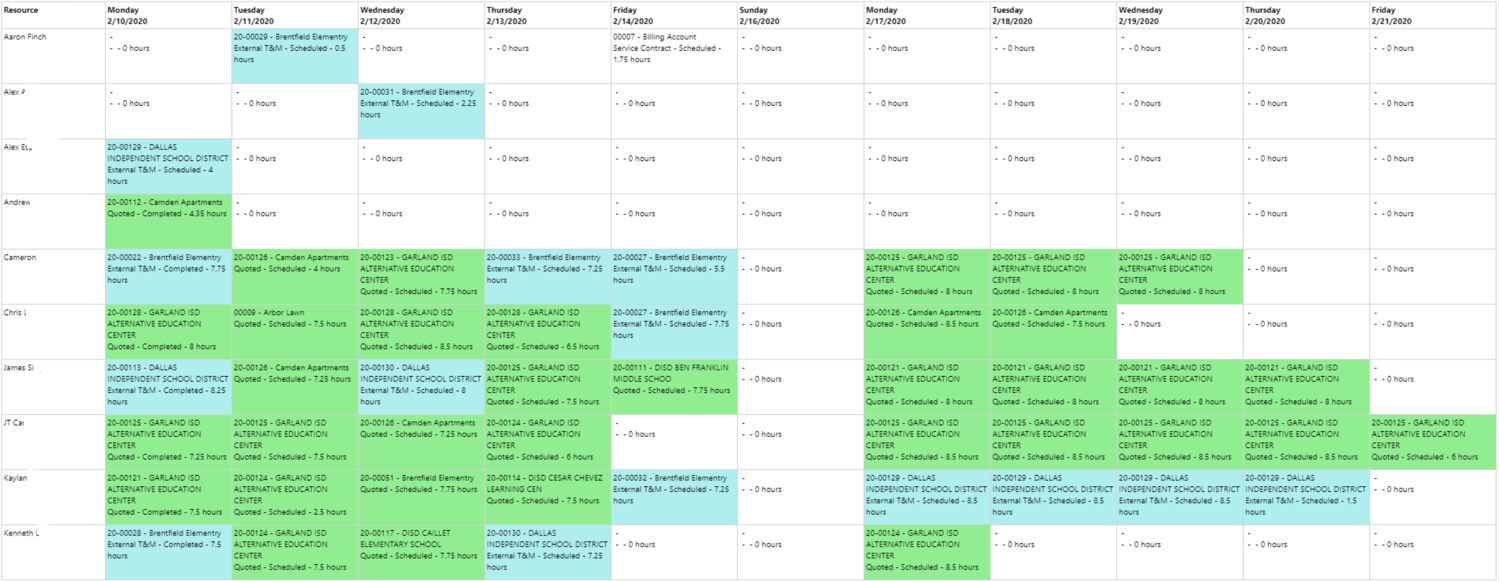
The lack of detail as you go to the daily or weekly view makes sense, to an extent, as a technician could be at multiple bookings in one day. However, many clients have work orders for one or more technicians that span multiple days and weeks and they want to see the details of where those folks will be as they start to look at schedule board beyond a specific day or 2. The purpose of this article is to show you how you can display these details using SQL Server Reporting Services. The final product looks like the below and then I’ll explain conceptually how you can create this report in Reporting Services.

Steps to create SSRS report
- Create your data source using the type of Microsoft Dynamics 365 Fetch and use a connection string like this.
- Create a dataset with the following fetchxml:
<fetch version="1.0" output-format="xml-platform" mapping="logical" distinct="false">
<entity name="bookableresourcebooking">
<attribute name="createdon" />
<attribute name="starttime" />
<attribute name="resource" />
<attribute name="endtime" />
<attribute name="duration" />
<attribute name="bookingtype" />
<attribute name="bookingstatus" />
<attribute name="bookableresourcebookingid" />
<attribute name="msdyn_workorder" />
<order attribute="starttime" descending="true" />
<filter type="and">
<condition attribute="starttime" operator="on-or-after" value="2020-02-10" />
<condition attribute="starttime" operator="on-or-before" value="2020-02-28" />
</filter>
<link-entity name="msdyn_workorder" from="msdyn_workorderid" to="msdyn_workorder" visible="false" link-type="outer" alias="workorder">
<attribute name="msdyn_serviceaccount" />
<attribute name="msdyn_workordertype" />
</link-entity>
</entity>
</fetch>
3. Add a column group with following group properties: =FormatDateTime(Fields!starttime.Value,DateFormat.ShortDate)
4. Add a row group with the following group properties: [resourceValue]
5. In the actual data cell, place a text box with the following properties: =Fields!msdyn_workorder.Value & " - " & Fields!workorder_msdyn_serviceaccount.Value & VBCRLF & Fields!a_workorder_msdyn_workordertype.Value & " - " & Fields!bookingstatus.Value & " - " & Fields!durationValue.Value/60 & " hours"
6. You can add some background color to that text box by using a nested IIF or case statement in the background color expression. I used the status field to drive the colors. This is just utilizing some SSRS expressions and you can find many examples on the web.
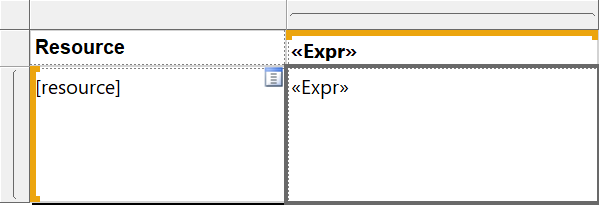
That’s it. Your report is super simple but super cool. The final version of the matrix has literally 3 cells and looks like this:


 RSMUS.com